“It ought to be remembered that there is nothing more difficult to take in hand, more perilous to conduct, or more uncertain in its success, than to take the lead in the introduction of a new order of things. Because the innovator has for enemies all those who have done well under the old conditions, and lukewarm defenders in those who may do well under the new. This coolness arises partly from fear of the opponents, who have the laws on their side, and partly from the incredulity of men, who do not readily believe in new things until they have had a long experience of them.”
― Niccolò Machiavelli, The Prince
“On paper we can do everything; we can do everything well. But, in reality we can't: because of politics; because of vested interests; because of short-termism, and; because of inertia.”
― Jeremy Grantham, Re|Source Speech
"Primum non nocere". In English: "First do no harm"
― Hippocratic Oath / Principle of Bioethics
"Argue for your limitations, and sure enough they're yours."
― Richard Bach
“One of the great mistakes is to judge policies and programs by their intentions rather than their results.”
― Milton Friedman
In a 27th of October 2013 blog post, which is titled Zimbabwe's Economy: Performance from 2013 to 2018, I grumbled that the economic strategy blueprints of the chief contenders in Zimbabwe's 2013 election did not:
- Clearly articulate how the contenders' economic visions would be operationalized; they did not satisfactorily delve into policy mechanics.
- Enunciate or stress-test the assumptions that underpinned each economic plan.
While I was authoring the-said post, the Government of Zimbabwe (GoZ) was in the process of conducting a series of stakeholder consultations that would culminate in the production of an economic strategic and tactical blueprint. This blueprint was christened the Zimbabwe Agenda for Sustainable Socio-Economic Transformation (ZimAsset). And, it will anchor the policy actions of the Zimbabwean government for the next five years.
At a fundamental level, the policy thrust of the Zimbabwean government will be centered upon:
- Adding value to ― as part of the common equity pools of mining firms' capital structures ― the nation’s natural resources (i.e. resource nationalism).
- Promoting equitable development and prosperity for all Zimbabweans (i.e. enhancing social security through the wealth redistribution vector). [1]
 |
| Illustration 1 (click on illustration to zoom in) |
As Illustration 1 shows, the pillars of the ZimAsset blueprint include:
- Food Security and Nutrition: Section 7.1 of the ZimAsset strategy document enunciates that the "thrust of the Food Security and Nutrition Cluster is to create a self-sufficient and food surplus economy and see Zimbabwe re-emerge as the 'Bread Basket of Southern Africa'. Ultimately, it seeks to build a prosperous, diverse and competitive food security and nutrition sector that contributes significantly to national development through the provision of an enabling environment for sustainable economic empowerment and social transformation."
- Social Services and Poverty Reduction: Section 7.2 of the ZimAsset strategy document states that the "thrust of the Social Services and Poverty Eradication Cluster is to enable the Government of Zimbabwe to improve the living standards of the citizenry for an empowered society and a growing economy".
- Infrastructure and Utilities: Section 7.3 of the ZimAsset strategy document states that the "Infrastructure Cluster is focused on the rehabilitation of infrastructural assets and the recovery of utility services in Zimbabwe. These services relate to: i. Water and Sanitation Infrastructure; ii. Public Amenities; iii. Public Amenities (sic); iv. Information Communication Technology (ICT); v. Energy and Power Supply; vi. Transport (road, rail, marine and air)."
- Value Addition and Beneficiation: According to Section 7.4 of the ZimAsset strategy document, the "Value Addition and Beneficiation Strategy is anchored on
the private sector taking a key role in the funding and execution of the
activities contained therein with Government providing the necessary support in
terms of alignment, consistency and cohesion of policies that include among others,
the Industrial Development Policy, National Trade Policy, National Tourism Policy,
Science, Technology and Innovation Policy, Minerals Development Policy,
National Procurement Policy, Indigenisation and Economic Empowerment Policy and
Local Authority Licensing and Regulation Policy."
These four pillars are buttressed by the following sub-clusters: 1) Fiscal Reform Measures, and, 2) Public Administration, Governance and Performance Management. To learn more about ZimAsset, you can access it here.
When I read the ZimAsset strategy document for the first time, I took note of the following things:
- ZimAsset is consistent with the interests and ideology of Zimbabwe's governing elites (and their key constituencies). Succinctly put: the economic strategy can garner enough internal political capital to survive until 2018.
- The state's role in the economy will no longer be confined to (the GNU-era role of) creating an enabling environment for investment; the state will increasingly play a direct role in asset allocation decisions, and, in controlling the means of production.
- Most of the aspects of the Food Security and Nutrition Cluster are resonant with my own convictions on improving Zimbabwe's food security.
- The Import Substitution policy (IS), which buttressed Zimbabwe's economic strategy between 1965 and 1994, has made a resurgence. [2]
Truth be told, I believe that economic growth can be generated by implementing any aspect of ZimAsset which enables Zimbabwe to accumulate more capital. This includes aspects of ZimAsset that are centered-upon repairing or rebuilding damaged infrastructure, building new infrastructure and acquiring new machinery. [20]
This is particularly true in instances where the requisite inputs for capital accumulation are sourced from suppliers, or contractors, who: 1) bank and spend the majority of their revenues in Zimbabwe, 2) employ Zimbabweans; 3) use labor intensive means of production, and; 4) Source requisite inputs from Zimbabwean suppliers.
Why do I hold this belief?
Answer:
Firms and governments employ a wide range of non-current assets with varying life spans. Broadly, non-current assets fall into the following categories: Structures, Transport Equipment, Computers, Other Communication Equipment, Software and Other Machinery and Equipment. Generally, each non-current asset category has its own unique rate of depreciation. Further, within a non-current asset category, depreciation rates also tend to vary across industries.
Each industry has its own unique admixture of non-current assets. By and large, these admixtures of non-current assets are principally morphed by technological progression, industry structure and pressures, and, consumer tastes.
If one ignores the heterogeneity of non-current assets, one can estimate the depreciation of different non-current asset categories as follows:
 |
| Table 1 (click on table to zoom in) Adapted From: Fraumeni, 1997 |
Most economists assert that 1999 was the inflection point in Zimbabwe's growth trajectory; the point at which Zimbabwe's hyper-inflationary journey began. If we postulate that no new tangible capital investment occurred after 1999, then as Table 1 shows:
- Structures that were constructed in 1999 would have a net lifespan of 35 years.
- Transportation Equipment that was purchased in 1999 would have a net lifespan of -9.71 years.
- Computers that were purchased in 1999 would have a net lifespan of -11.83 years.
- Communication Equipment that was purchased in 1999 would have a net lifespan of -6.30 years.
- Software that was purchased in 1999 would, like computers, have a net lifespan of -11.83 years.
- Other Machinery and Equipment that was last purchased in 1999 would have a net lifespan of -7.06 years.
Basically, this serves to show that Zimbabwe's "non-Structures" capital stock ― i.e. Transportation Equipment, Computers, Communication Equipment, Software and Other Machinery and Equipment ― is overdue for replacement; it's behind by roughly two capital replenishment cycles.
Ceteris paribus, one can expect Zimbabwe's productivity and economic growth to improve if the nation's capital stock is replenished.
Succinctly, Zimbabwe is at the stage of development where it would register positive growth by employing any economic strategy ― including ZimAsset ― that helps it to marshal resources. However, this statement does need to be qualified:
Table 2, below, shows the total factor productivity trends of fourteen (out of thirty-one) industries that were studied by Bjurek and Durevall (1998):
 |
| Table 2 (click on table to zoom in) Adapted From: Bjurek and Durevall, 1998 |
In aggregate, the industries in Table 2 became less productive with the passage of time; they increasingly lost their technological dynamism as Zimbabwe implemented the Economic Structural Adjustment Programme (ESAP) and liberalized (between 1991 and 1995).
Clearly, this suggests that the industries in question were:
- Inherently uncompetitive; they benefited from the "market protections" that were accorded to them by Zimbabwe's Input Substitution (IS) policy (which reigned from 1965 to 1994) [2];
- Increasingly unable to assimilate, or invest in, productivity enhancements as they became exposed to competitive pressures from within and without. This suggests the following chain of causation: Market Liberalization → Increasing competition → Falling revenues → Falling free-cashflows → Inability to invest in productivity enhancements → Falling productivity → Falling competitiveness.
Hence, it stands to reason that it would be unwise to immediately try to revive these particular industries.
***
To lift Zimbabwe from her economic malaise, the architects of ZimAsset would need to overcome the following insurmountable hurdles:
 |
| Illustration 2 (click on illustration to zoom in) |
The hurdles in Illustration 2 include:
- Idiosyncratic Factors and Political Realities.
- Funding Constraints and Realities of the Global Economy.
- Debt Sustainability Issues.
They will be discussed in the following sections:
...Idiosyncratic Factors and Political Realities
This section discusses the qualitative factors that will impact the implementation of ZimAsset. By and large, they are the primary factors that will make or break ZimAsset.
***
"The need that predominantly drives human nature is self-preservation. Generally, human nature trumps cultural norms 100% of the time."
― Kyle Bass, The Coming Crisis in Japan
Illustration 3, below, shows the key elements of ZimAsset:
 |
| Illustration 3 (click on illustration to zoom in) Adapted From: ZimAsset |
As Illustration 3 shows, ZimAsset has the following key elements:
- Quick Wins: The quick win policies in ZimAsset, are in essence, non-paradigmatic change initiatives. They will be undertaken to realign Zimbabwe's institutional framework with the new constitution and the envisaged policy direction. Further, the quick win policies also seek to stabilize the country and resuscitate the institutional framework that buttressed the Import Substitution (IS) policy between 1965 and 1994. By and large, quick win policies will be rolled out in a dramatic fashion between 2013 and 2015. I firmly believe that these policies can be rolled-out using the government of Zimbabwe's current portfolio of resource capabilities and competencies; they don't necessitate novel approaches per se.
- Transformational Policies: The transformational social security and value addition policies, are in essence, paradigmatic change initiatives that will necessitate simultaneous interrelated fundamental change initiatives. Otherwise put, they are revolutional change initiatives that require changes in the behaviors, organizational cultures and the prevalent attitudes in civil service [3].
 |
| Illustration 4 (click on illustration to zoom in) Adapted From: Balogun and Hope Hailey, 2004 |
The highlighted parts in Illustration 4 demonstrate that:
- The "Quick Wins" and the core elements of ZimAsset, are, in essence, big bang change initiatives that will be rolled-out in a dramatic fashion.
- The "Quick Wins" will allow the government of Zimbabwe to reconstruct broken institutions and repair decrepit infrastructure.
Clearly, it stands to reason that the transformational elements of ZimAsset necessitate immediate accumulation and deployment of the following resources and capabilities [7]:
| Illustration 5 (click on illustration to zoom in) Adapted From: Perich, 1992 |
See footnote [4] for a detailed explanation of Illustration 5.
In Illustration 5, the benefits of the ZimAsset change initiatives are depicted by the movement from the stable state in point a to the dynamic state in point c. As Illustration 5 demonstrates, this movement can only occur after the government of Zimbabwe builds the following requisite capabilities:
- Reputation Management: Since 2001, there has been a roaring debate on whether the sanctions, that were imposed by the US government and the EU, are targeted or broad-based. While the EU and the US insist that the sanctions that they imposed are targeted, there is a compelling body of evidence which suggests that they are not. For instance, Olivine Industries ("Olivine") ― a former holding company of H.J. Heinz; which manufactures edible oils, fats and soaps ― was compelled, by the US's Zimbabwe Democracy and Economic Recovery Act (ZIDERA), to refrain from acquiring inputs from beneficiaries of Zimbabwe's controversial land reform initiative. The effects of this policy amalgamated with Zimbabwe's economic peculiarities to have the following net-impact: 1) Eradication of farmers' incentive to grow sunflower seeds - there was no viable market; 2) Acute shortages of sunflower seeds and edible oils in Zimbabwe, which, in turn, inflated their prices; 3) A sustained decline in Olivine's capacity utilization (to a low of 30% in 2009), and; 4) Redundancy and underemployment of Olivine's workers. Another instance: Between 2007 and 2008, the EU blocked a paid-up shipment of currency printing supplies that had been procured, from a German supplier, by the Reserve Bank of Zimbabwe. The stated reason for blocking the shipment: "it would prop-up the Mugabe regime". The net-impact of blocking the shipment: There was a shortage of cash in Zimbabwe, and, onerous cash rations had to be implemented. Having said this, it is important to stress that the sanctions had the following undeniable origins: 1) The violence and looting sprees that accompanied Zimbabwe's mob-administered land reform initiative; 2) The implementation of laws, and, official and unofficial policies that curtailed vital democratic freedoms (i.e. freedom of speech, freedom of assembly and press freedom); 3) Well-documented incidents of targeted political violence that had "some level" of state involvement, and; 4) Electoral irregularities. To shed-off Zimbabwe's pariah status, the government of Zimbabwe would need to make sustained efforts to remedy the stated deficiencies. If the deficiencies are addressed, uncertainty would evaporate and direct investors would have an inclination to commit funds to the targeted sectors of the Zimbabwean economy. Further, Zimbabwe's bad reputation in the credit markets, one of the sources of Zimbabwe's fiscal constrainment, stems from the sovereign debt defaults that occurred in 1997, 2000 and 2006. To address Zimbabwe's poor reputation with lenders, the government of Zimbabwe would need to exhibit greater fiscal integrity by religiously honoring the nation's debt obligations. To close off, going forward, the government of Zimbabwe would need to operate in a manner which demonstrates that it is cognizant of the following reality: a reputation for instability and lack of fiscal integrity has the same net-impact as economic sanctions.
- Stakeholder Management: By and large, Zimbabwe's reputational issues stem from poor management of internal stakeholders. Whenever Zimbabwe is on the path of fiscal rectitude, an internal stakeholder contingency usually surfaces with a short-term demand which the Zimbabwean government feels compelled to oblige [28]. Usually, this has the consequence of: a budget deficit, inflation, increasing indebtedness, rising taxes, or a combination of the aforementioned effects. A case in point: In 1997, a radical group of impoverished war veterans threatened to destabilize the country if they were not paid handsome gratuities for the role that they played in the liberation of Zimbabwe [5]. The Zimbabwean government responded to this unbudgeted request by printing money for the gratuities. This had the net effect of triggering run-away inflation and causing interest rates to spiral to uncharted heights. Currently, civil servant salaries account for, depending on how you count, 60% to 70% of Zimbabwe's 2014 budgetary expenditures [8]. As it stands, civil servants are negotiating a salary increment that would bring their share of fiscal spending to approximately 80%. While Zimbabwean civil servants do receive meager remuneration, there is no money to award them the increments they desire without causing undue fiscal pressures. Clearly, the Zimbabwean government would need to bolster its internal stakeholder management capabilities. If this doesn't happen, it would continue to make unsustainable commitments that derail Zimbabwe.
- A Performance-Oriented Culture: By and large, civil servants have indefinite job security regardless of whether their performance is up to standard or not. Otherwise put, there is a longstanding implicit contract in Zimbabwe's civil service which can be abbreviated as follows: low pay and a relaxed working environment in return for job security, a lump-sum pension and a 'retirement salary' for life. It stands to reason that the introduction of a Results Based Management System, would, in essence, mean an abrogation of the aforementioned contract; work pressure would increase for the average civil servant and the job security of top civil servants would be reduced [25]. This could create questions of legitimacy if senior members of government do not espouse the values that they proselytize (and expect others to live by). The best way to build a performance oriented culture would be for senior members of government to practice what they preach.
- Transformational Leadership (TL): TL is the only leadership style that would suffice for implementing the interrelated big bang change initiatives that fall under the "ZimAsset" umbrella term. Transformational Leadership is a vision-driven leadership style that induces followers to desire change, improvement, and, being led. Bass (2003) is an authority on Transformational Leadership; he authored the gold standard for implementing transformational leadership (it can be found here). In my opinion, the most intractable challenge that the government of Zimbabwe would face is implementing a transformational leadership style across all areas of government. From my vantage point, this soft factor will make or break ZimAsset.
- Policy Innovation: Throughout the world, and across the sweep of time, governments have wrestled with the exact same problems; Healthcare, Taxation, Crime, War, Morality, Human Rights, Productivity, Sustainability, Energy, Equity, Waste Management, Well being, Economic Growth, Employment, Food Security, Population Control and Social Security. However, they have tackled these problems in a myriad of infinitely different ways. Some governments have been very successful; others have achieved a moderate level of success; while others have failed abysmally. Succinctly put, there are natural public policy experiments that are being conducted across space and time. Instead of trying to reinvent the wheel, the Zimbabwean government, or rather the president's office of the Zimbabwean government, could build a policy innovation lab that tracks [6]: 1) How different societies have tackled the aforementioned problems; 2) What works universally; 3) What doesn't work in specific contexts, and; 4) What would work in the Zimbabwean context. Whenever policies fail to achieve their envisaged results, the government of Zimbabwe could combine policy insights from the-said policy data bank and on-the-ground insights to formulate remedial measures. This is the approach that the government of Singapore has employed since the 1960s with great success.
In my opinion, the above-mentioned resource capabilities are the true Key Success Factors (KSFs) of ZimAsset [7].
***
Tables 3 and 4 contain elements of Balogun and Hope Hailey's (2004) Change Kaleidoscope; they are used to map-out ZimAsset's change context:
 |
| Table 3 (click on table to zoom in) Adapted From: Balogun and Hope Hailey, 2004 |
Table 4, below, is a continuation of Table 3:
 |
| Table 4 (click on table to zoom in) Adapted From: Balogun and Hope Hailey, 2004 |
From Tables 3 and 4, the following is evident:
- Given the shortage of time, lack of a compelling impetus for change and the scale of the envisaged changes, it is prudent to implement ZimAsset using a top-down approach. Otherwise put, the centralized-approach that is being employed, by the Zimbabwean government, to implement ZimAsset is in sync with the contextual dictates of Zimbabwe.
- Currently, the Zimbabwean government lacks the capabilities to implement the more transformational aspects of ZimAsset (refer back to Illustration 5). Thus, it makes sense to immediately focus on the aspects of ZimAsset that would facilitate a realignment. Otherwise put, the "Quick Win" approach to implementing ZimAsset is in sync with the contextual dictates of Zimbabwe.
- The best way to implement the transformational aspects of ZimAsset is via a "change through attrition" modus operandi; i.e. to allow people who fail to adapt, or, exhibit the greatest resistance to change to leave civil service [8]
Tables 3 and 4 also reveal that soft-factors; like culture in different arms of civil service and organizational politics, pose the greatest threat to the successful implementation of ZimAsset. Illustration 6 expounds;
 |
| Illustration 6 (click on illustration to zoom in) |
As Illustration 6 demonstrates, there are four types of civil servants in Zimbabwe (be warned: this is an over-simplification):
- The Grafters (represented by the woman who is holding a shovel in Illustration 6): These are the people who consistently strive hard to produce a high standard of work in a professional manner.
- The Fief Lords (represented by the man who has the woman in a headlock in Illustration 6): These are the megalomaniacs who are always having territorial battles with anyone who dares to cross their paths.
- The Looters (represented by the knife-wielding man with the dollar-sign halo in Illustration 6): These are people who are looking, within their spheres of influence, for legal, extra-legal or illegal opportunities for financial aggrandizement.
- The Stoners (represented by the people who are relaxing in Illustration 6): These are the laid-back people who aim to exert the minimum level of effort for the highest level of remuneration.
Over time, the cultures of different arms of civil service tend to be shaped by the attitudes of the dominant individuals. For instance, an arm of civil service which is dominated by individuals who are Looters, will, over time, develop a looting culture; an arm of civil service which is dominated by individuals who are Stoners, will, with the passage of time, develop a laid-back culture and so on.
With the implementation of the Results Based Management System, and the launch of the transformational change initiatives, one can expect the energy states of various arms of civil service to follow the trajectories in Illustration 7:
 |
| Illustration 7 (click on illustration to zoom in) Adapted From: Bruch and Vogel, 2011 |
For a description of what energy states are, see footnote [9]
To expound:
- Fief Lords: Generally, the energy state of the arms of civil service that are dominated by Fief Lords is Corrosive. It won't change with the implementation of the change initiatives; it will simply become more noxious. By and large, in arms of civil service that are dominated by Fief Lords, people will: 1) Actively hinder change and innovation; 2) Seek to weaken pro-change camps, and; 3) Display an attitude of cynicism towards the state's goals and objectives.
- Looters and Stoners: The energy state of the arms of civil service that are dominated by Looters and Stoners is inherently Comfortable; there is a relaxed atmosphere in work groups, and, people generally prefer the status quo. The implementation of the Results Based Management System would introduce something that Looters and Stoners are not comfortable with: scrutiny and accountability. Thus, it is reasonable to expect the energy state of arms of civil service that are dominated by Looters and Stoners to morph into Corrosive Energy. This is demonstrated by the navy blue arrow in Illustration 7.
- Grafters who lacked support and adequate resources: The energy state of the arms of civil service that are dominated by Grafters who lacked adequate resources and support can best be described as Resigned energy; they are mentally withdrawn from their work and do what is required of them and no more. Since the changes are being implemented dramatically and in a top-down fashion, these Grafters may feel marginalized; they have opinions on what needs to be done that they need to be heard. Hence, in the short-term it is reasonable to expect the energy state in such departments to morph from Resigned Inertia to Corrosive Energy. This is demonstrated by the red arrow in Illustration 7.
- Grafters during the early phases of the change: The implementation of the transformational aspects of ZimAsset will certainly morph the energy state of Grafter-arms of civil service from Productive Energy to Resigned Inertia as is shown by the green arrow in Illustration 7. There is nothing odd about this, this is just how people initially deal with change (refer to Illustration 8).
Therefore, it is reasonable to assert that there would be a time when the predominant energy state of civil service is Corrosive Energy [10]. During the implementation of the transformational change initiatives, there are two key phases wherein the risk of failure would be relatively high:
| Illustration 8 ( click on illustration to zoom in) Adapted From: Vogel, 2011 |
As Illustration 8 demonstrates, these phases include:
- The Blue Phase / Transitional Phase: As Illustration 8 shows, during the early phases of the implementation of the core elements of ZimAsset, overall performance may dip as civil servants, Grafters included, experience feelings ranging from anger, panic and depression. Evidently, the Results Based Management System cannot be implemented too rigidly until civil servants have made a psychological reorientation to the change. If the Change Agents fail to give each civil servant individualized consideration at this stage, the transformational elements of ZimAsset would fail to take root. Of critical importance is the ability to isolate performance issues that stem from genuine transitional difficulties from those that stem from incompetence.
- The Green Phase / Experimental Phase: Once civil servants have accepted the changes they will, as Illustration 8 shows, feel inclined to experiment. If experimentation is prohibited, performance may plateau. To facilitate continual policy evolution and adaptation, civil servants can, at this stage, be given the leeway to experiment with different approaches to policy implementation. Generally, experimentation demands an environment that: 1) is somewhat tolerant towards mistakes, and; 2) values and rewards innovation. Thus, it would be prudent to incorporate additional performance measurement dimensions including; innovation and experimentation.
Clearly, the transformational elements of ZimAsset would be the most difficult to implement. However, the ultimate test that ZimAsset will endure is that of debt sustainability.
***
...Funding Constraints and Realities of the Global Economy
In this section, I will discuss the quantitative factors that will determine the success or failure of ZimAsset. Unlike the qualitative factors, the quantitative factors are much less subjective.
I'll start off by exploring the capacity of different donor nations to fund ZimAsset. Then, I'll use ten scenarios that are comprised of two vulnerability metrics ― including the Indebtedness to GDP ratio and the Interest Payments to Government Revenue ratio ― to establish Zimbabwe's debt capacity, and, its ability to fund ZimAsset using debt from the euro-bond market.
Once I have established the scenarios that are broadly sustainable, I will expand each shortlisted macro scenario to ten sub-scenarios that are comprised of four debt metrics ― Cluster 1 Metrics; Interest to Income ratio and Debt to GDP ratio, and Cluster 2 Metrics; Debt Service to Income ratio and Debt to Income ratio ― to unearth the nuances of Zimbabwe's debt capacity
***
"There is a price to be paid for foreign aid. That is, the recipient makes policy concessions to the donor. Aid benefits the donor government; because the donor government gets policies that its constituents want ― i.e. the donor country is almost always a democracy. But it harms the citizenry of the recipient country because they are getting policies that they do not want."
― Bruce Bueno De Mesquita, EconTalk Interview
According to the ZimAsset policy document, the policy would be funded as follows:
"In order to ensure that the Plan is fully funded, the following, interalia, have been identified as financing mechanisms: tax and non tax revenue, leveraging resources, Sovereign Wealth Fund, issuance of bonds, accelerated implementation of Public Private Partnerships, securitization of remittances, re-engagement with the international and multilateral finance institutions and other financing options, focusing on Brazil, Russia, India, China and South Africa (BRICS)"
The statement "Other financing options, focusing on Brazil, Russia, India, China, and South Africa" implies securing aid and or soft-loans from Brazil, Russia, India, China and South Africa (BRICS).
According to pronouncements that were made by officials from Zimbabwe's Ministry of Finance, ZimAsset requires USD27 billion in financing. Hence, this begs the following question: How much of the USD27 billion can the named donor countries contribute?
Out of the named donor countries, China is the only country with a history of making substantial aid contributions to Zimbabwe. This suggests that China has got vital interests in Zimbabwe. Hence, it is reasonable to expect the bulk of the aid contribution to come from China. Further, the other BRICs countries are reeling from the recent emerging markets crisis. Thus, it is reasonable to expect them to make marginal contributions to Zimbabwe.
Table 5, below, expositions the aid projects that China has conducted in Zimbabwe between 2000 and 2011 ― a period of time amounting to eleven years:
 |
| Table 5 (click on table to zoom in) Adapted From: Aid data, 2014 |
As Table 5 demonstrates, between 2000 and 2011, China 'conducted' 135 aid projects in Zimbabwe. It is important to stress that these aid flows were an admixture of soft loans, monetary grants, in-kind grants and free-standing technical assistance.
In aggregate, the aid dispensed between 2000 and 2011 is approximately USD5.416 billion, which translates to roughly USD492,363,636.36 per year over the eleven-year period (in 2009 USDs), or, USD545 million per year (in 2014 USDs) [11].
By and large, when China made these aid contributions, she sought to:
- Originate "vendor-financed" infrastructure projects for China's state-owned construction, engineering and electrical firms. Hence, it is reasonable to assert that most of the direct economic benefits from the projects ― including high paying construction sector jobs, some low paying construction sector jobs, engineering jobs, procurement contracts and project financing opportunities ― were realized in China.
- Build relationships that would secure her energy needs.
- Open Zimbabwean markets to Chinese enterprises.
In 2011, China introduced its 12th Five Year Plan. The plan unequivocally demonstrates that China's leaders:
- Seek to reorient her economy towards a more sustainable domestic-consumer-led growth path. Otherwise put, they seek to shift China's growth model away from the export-and-investment-led model.
- Are targeting a modest growth rate in the 7-8% band to prevent the Chinese economy from overheating.
- Seek to combat pollution; they seek, according to the words of Xi Jinping, "more efficient development".
Clearly, the first bullet point suggests the following: Going forward, China's leaders will spend less time originating, on the behalf of state-owned firms, international infrastructure projects. Thus, it stands to reason that less time spent originating "vendor financed" infrastructure projects roughly translates into less infrastructure aid.
During the period that was explored in Table 3, infrastructure aid ― i.e. aid expenditures on Energy Generation and Supply, Water Supply and Sanitation, Transport and Storage, Communications and Industry and Mining ― accounted for 50.46% of the aid spending. Hence, it stands to reason that a reduction in infrastructure aid would adversely affect the aggregate aid spending substantially.
Illustration 9, below, shows China's energy use in 2009:
 |
| Illustration 9 (click on illustration to zoom in) Adapted From: Pivot Capital Management, 2009 |
As Illustration 9 shows, China uses more energy per unit of GDP than any other country in the world; i.e. China is energy inefficient. According to Pivot Capital Management:
"China is also the world’s second largest and unfortunately also one of the least efficient consumers of energy: per unit of GDP China consumes close to six times more energy than Italy, and three times more than the USA."
"Heavy industry is notoriously inefficient with China’s steel makers using on average 20%, cement manufacturers 45% and ethylene producers 70% more energy per ton of output than producers elsewhere. The reasons for such inefficiencies are manifold, but are primarily related to the way energy prices are set in China. Companies, and especially provincial SOEs, receive numerous breaks and subsidies for electricity consumption. These inefficiencies have probably also led to an overestimation of future power generation and energy needs, another important area of capital spending in recent years."
As I have already alluded to, going forward, China will be targeting more efficient development; this implies that China's energy efficiency is set to increase in the future. If China doubles her energy efficiency, her total energy needs would, ceteris paribus, fall by 25% to 50%. This serves to demonstrate that, in the medium term, China will not need more of Africa's energy resources.
To sum-up, the reorientation of the Chinese economy ― from an export-led growth model to a domestic-consumer-spending-led growth model ― implies that the Chinese economy will be less reliant on exports. By extension, this implies that, going forward, China will not have a driving need to access foreign markets. It is also reasonable to argue that China's energy security will no longer be the key determinant of its Africa foreign policy and aid policy. Hence, it stands to reason that China's future aid to Zimbabwe cannot be expected to exceed its historical average; USD545 million per year (in 2014 USDs) [11].
To stimulate her economy, China injected USD1 trillion of liquidity, 25% of the nation's GDP in 2009, into her economy. In effect, this action switched the nation's growth model from an export-led growth model to an investment-led growth model.
Within a short space of time, the sea of liquidity fueled an unprecedented infrastructure and real-estate investment boom. Unfortunately, this investment boom overshot and quickly morphed into a bubble; a credit bubble with an infrastructure and real estate overlay.
As it stands, China has reached the limits of the investment-led growth model. Owing to this, her credit bubble may soon deflate. [24]
From 2009 to 2012, the banking assets in China ― excluding the shadow banking system ― grew at an annualized rate of 50%. By some estimates, China's Banking Asset to GDP ratio is 350%. Currently, China's non performing loans stand at 1% of total banking assets. However, over the last 20 to 25 years, they averaged 19% of total banking assets in normal times, and, 35% of total banking assets in troubled times [12].
Table 6, below, shows, in nominal terms, the possible range of values of China's non-performing loans under eight scenarios:
 |
| Table 6 ( click on table to zoom in) Adapted From: NYU Stern SRisk, 2014 |
From Table 6, it is evident that:
- The current proportion of non-performing loans in China's banking system, 1% of total banking assets, translates to around 10% of China's foreign currency reserves.
- If China's proportion of non-performing loans reverts to its 20-year historical average, i.e. 19% of the banking system's total assets, it would be equivalent to half of China's foreign currency reserves.
- If China's proportion of non-performing loans reaches its historical crisis level, i.e. 35% of the banking system's total assets, 80% of the nation's foreign currency treasure chest would be literally consumed.
Given that China's banking system sits on rocky ground; it is reasonable to assert that China literally has little money to spare. [22]
China's 140-160 million-strong migrant workforce has been increasingly agitating for reforms in the Hukou system. Basically, the Hukou system determines who is or isn't eligible to receive benefits like social housing, education, childcare and healthcare.
Currently, China’s laws preclude migrant workers from receiving such benefits. Expectedly, this has been the source of great social discontent. According to estimates that were produced by the nation’s State Council in 2011, it would cost roughly USD 12,300 per person to confer social benefits to migrant workers. This roughly translates to around USD1.7 to 2 trillion; a figure that amounts to between 49% and 57% of China’s reserves. [27]
Again, this unequivocally demonstrates that China literally has little money to spare.
 |
Illustration 10 (click on illustration to zoom in) Adapted From: USAid, 2012
|
As Illustration 10 demonstrates, US aid to Zimbabwe had three major peaks:
- 1982: Zimbabwe had just become a multiparty democracy with the one-man-one-vote principle. And, the country had experienced a severe drought.
- 1992: Zimbabwe had just liberalized her economy (ESAP); she had abandoned the Input Substitution policy. During this year, Zimbabwe also endured a major drought and needed food aid.
- 2009: Zimbabwe's governance structures had become more inclusive; the country had just formed a Government of National Unity.
Hence, one can reasonably surmise that US aid to Zimbabwe increases when: 1) the country makes a governance stride that is consistent with the US's values; 2) the nation experiences a natural disaster, and; 3) Zimbabwe's economy liberalizes.
In 2013, Zimbabwe held general elections, that were deemed by the US to be unfair. Further, the re-introduction of the Import Substitution (IS) policy effectively shuts segments of Zimbabwe's markets from US exporters. Furthermore, Zimbabwe's version of capitalism, wherein the state plays a direct role in asset allocation decisions, is not in alignment with the US's values. Hence, one can argue that going forward, US aid flows to Zimbabwe will not, ceteris paribas, register any significant uptick.
The EU-block is also another significant donor to Zimbabwe. Illustration 11, below, is an infographic that describes the nature of the EU's aid to Zimbabwe:
 |
| Illustration 11 (click on illustration to zoom in) Adapted From: European Union EEAS, 2014 |
As Illustration 11 shows:
- Since 2002, EU member states contributed €1.5 billion to Zimbabwe.
- The EU has a predictable annual rate of aid to Zimbabwe; €90-100 million.
- 80% of Zimbabwe's supply of vital medicines originates from EU-member states.
- 24% of Zimbabwe's supply of fertilizer originates from EU-member states.
While the EU was not impressed by the manner in which Zimbabwe's 2013 elections were conducted, the bloc has demonstrated an inclination to re-engage with Zimbabwe as is. For instance:
- Since 2013, the EU has been removing Zimbabwean governing elites from its targeted sanctions list. As it currently stands, there are only two Zimbabweans who are left on the list.
- The EU recently indicated that it would resume making fungible aid donations to Zimbabwe.
By all indications, relations are thawing and aid flows may increase.
Between 2009 and 2013, the EU made €365 million in aid contributions to Zimbabwe. This translates to €73 million per year; i.e. a contribution which is €17 million to €27 million below the long term average of the bloc's annual contribution to Zimbabwe. One can reasonably assert that the proximate cause of this decline in aid contributions was the Eurozone crisis that unfolded soon after the global financial crisis of 2009. This suggests that the EU's aid contributions to Zimbabwe are elastic; they're directly related to the bloc's economic health.
Out of the 27 member states of the Eurozone, only the UK recapitalized its banking system (after the financial crisis of 2009). On average, banks in the EU are, by some estimates, about three times as leveraged as banks in the US.
Since credit is the lifeblood of the modern economy, one can reasonably assert that this capital deficit would have a drag-effect on the region's growth. This may, in turn, curtail the region's ability to extend aid to Zimbabwe.
***
 |
| Table 7 (click on table to zoom in) |
Over a five year period, these aggregated aid flows would translate to USD4.35 billion to USD5.35 billion in aid commitments.
***
According to projections in the ZimAsset strategy document, the policy is expected to produce GDP growth of: 3.4% in 2013, 6.1% in 2014, 6.4% in 2015, 6.5% in 2016, 7.9% in 2017 and 9.9% in 2018 [13]. This translates to, if you exclude the 2013 GDP growth rate, an average growth rate of 7.36%. As I have alluded to elsewhere, the policy will cost USD27 billion (USD5.04 billion per year).
Thus, these GDP and cost projections can be expressed in Illustration 12 as follows:
 |
| Illustration 12 (click on illustration to zoom in) Adapted From: ZimAsset Projections |
With the incremental GDP figures and cost projections in Illustration 12, the return on investment of ZimAsset can be ascertained:
 |
| Illustration 13 (click on illustration to zoom in) Adapted From: ZimAsset Projections |
As Illustration 13 shows, the return on investment (ROI) of ZimAsset increases marginally during the first three years of ZimAsset, after which, it increases by 5 percentage points between 2016 and 2017, and, 7 percentage points between 2017 and 2018.
Clearly, when ZimAsset is assessed using the ROI metric, its performance is, by all standards, acceptable.
***
"Four years ago we stood at the edge of the great abyss. And since that time, we have taken a Great Leap Forward"
― Chairman Mao
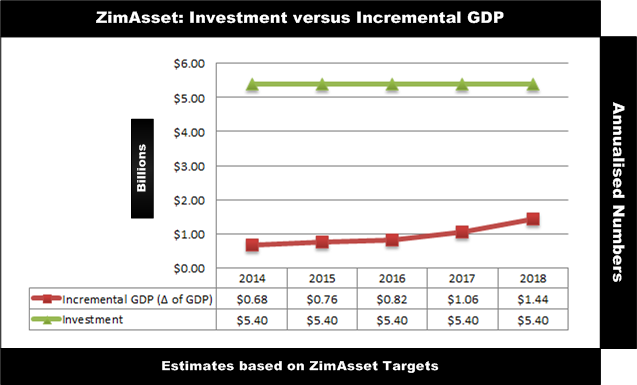 |
| Illustration 14 (click on illustration to zoom in) Adapted From: ZimAsset Projections |
As Illustration 14 demonstrates, in each year, the incremental GDP that is generated by ZimAsset is much lower than the annual investment. Otherwise put, ZimAsset is a capital intensive economic policy. Its sustainability will largely depend upon how the annual USD5.40 billion investment is funded.
In the forthcoming sections, the question of funding ZimAsset will be explored.
***
Illustration 15 shows the trajectory of commodity prices over the last 20 years:
 |
| Illustration 15 (click on illustration to zoom in) Adapted From: Index Mundi |
As Illustration 15 demonstrates, commodity prices were relatively flat between 1999 and 2002. From 2002 to 2012, commodity prices 'awoke from their stupor' and they followed the trajectory that is shown by the trend arrows in Illustration 15.
The driver of this uptrend in commodity prices was China. As Illustration 16 demonstrates, since 2006, China has been a major consumer of oil, iron ore and cement:
 |
| Illustration 16 (click on illustration to zoom in) |
Illustration 16 shows the following:
- Since 2006, China has consumed 49% of the world's supply of iron ore.
- Since 2006, China has consumed 61% of the world's supply of cement.
- Since 2006, China has consumed 49% of the world's supply of coal.
The main driver of this mammoth consumption of the named commodities was the construction and fixed capital investment boom that was/is occurring in China.
A report that was authored by Pivot Capital Management (2009), which is titled China’s Investment Boom: the Great Leap into the Unknown, demonstrates, convincingly, that China has hit the uppermost limit of this construction boom. The report states the following:
"The experience of the Asian tigers, as well as the post-war reconstruction periods of Germany and Japan, provides highly relevant benchmarks for analyzing China’s multi-decade growth process and current situation. The eventual reversion of investment ratios in those countries tells a cautionary tale on its own, however, what makes the situation even more alarming, is the rapidly decreasing efficiency of China’s investments. In the third decade of expansion, the Incremental Capital Output Ratio (ICOR) in China has markedly deteriorated compared to the previous two decades as well as to other high-growth countries in their pre-peak investment stages. In 2009 China’s ICOR will be more than 2 times higher than the 80s and 90s average ."
"The falling marginal returns on investment are symptomatic of the increasingly speculative nature of China’s capital spending boom, where a self-feeding process of credit growth and investments in manufacturing, infrastructure and real estate is currently under way. This process has been reinforced by central and local party officials eager to address bottlenecks through building so much capacity as to make sure they would not need to ask for more money in the current 5-year plan, simultaneously maximizing short-term growth. However, the decreasing efficiency of investments will ultimately lead to a pullback in capital expenditures. In a soft landing scenario, China is likely to shift to a lower growth trajectory for the next decade. In a hard landing scenario, which is entirely feasible, there would be an abrupt decline in capital spending exacerbated by a banking crisis."
In the particular case of iron ore; since the 1900s, the commodity's real price was relatively flat at USD50 per tonne (in 2012 USDs) . During the early 2000s, the price increased to around USD200, in real terms, owing to China's exponential growth in fixed capital investment. It is reasonable to assert that if, or rather when, the pullback in infrastructure spending occurs in China, the price of iron ore would be hit hard; in the worst-case scenario, it may even trend back to its longterm pre-2000s average. [14]
Between 2008 and 2009, China produced 500 million tonnes of steel more than EU, Japan, US and Russia combined. Further, the idle capacity of China's steel industry was equivalent to the capacity of Japan and South Korea's steel industries combined. Furthermore, in 2009 China had close to 60 million tonnes of steel capacity under construction.
Thus, if the pullback in China occurs, China will be left with significant excess steel capacity. [15]
Thus, if the pullback in China occurs, China will be left with significant excess steel capacity. [15]
Therefore, it is reasonable to assert that there will be very few companies that would be willing to make new tangible steel investments in a global macro environment with the:
- Risk of falling steel prices.
- Substantial excess Chinese supply.
"The resuscitation and growth of the manufacturing sector will be premised on the following conditions":
- "Resumption of operations at New ZimSteel (formally ZISCO-Steel)";
- "Establishment of new iron and steel companies";
Clearly, the assumptions in ZimAsset demonstrate that the manufacturing industry of Zimbabwe cannot takeoff unless there is substantial investment in the country's iron and steel industry. As I have alluded to elsewhere, owing to the reorientation process that is currently underway in China, private sector investors will be reluctant to commit substantial capital to iron and steel investments.
Hence, eager to resuscitate the economy, the GoZ will have no alternative but to fund steel investments using sovereign debt. Naturally, this begs the questions:
- How much debt capital can be used to fund ZimAsset?
- What would be the sustainable debt level?
***
The question of debt sustainability is very pertinent.
Illustration 17, below, charts the delta of Zimbabwe's GDP, and, the Change in her Public and Private External Debt (as a Proportion of Gross National Product) between 1971 and 2007. Illustration 17 can be used to ascertain the relationship between Zimbabwe's indebtedness and her productivity:
 |
| Illustration 17 (click on illustration to zoom in) Adapted From: University of Groningen, 2014 |
As the shaded regions in Illustration 17 demonstrate, whenever Zimbabwe's debt burden grew at a fast pace, the nation's productivity fell. This could suggest either, or both, of the following things:
- Zimbabwe uses her debt inefficiently; she borrows to invest in marginal activities.
- Increasing debt service costs constrain the nation's ability to invest in productivity enhancements.
Illustration 18 reveals what I found:
 |
| Illustration 18 (click on illustration to zoom in) Adapted From: Rogoff, 2014; University of Groningen, 2014 |
Interestingly, the analysis in Illustration 18 gave me a result that was similar but slightly different to the result I got in Illustration 17. Illustration 18 shows that whenever the change in debt peaked, the change in Zimbabwe's productivity hit a minima.
One day, I hope to further-interrogate the causal dynamics that underpin this relationship. But what it does unequivocally indicate is: Zimbabwe's denizens need to be worried about policies that grow debt rapidly. [23]
Research that was conducted by Ken Rogoff and Carmen Reinhart (2004-2010), Kenneth Koo (2011) and Ray Dalio (2013) unequivocally demonstrates that periods of rapid debt accumulation culminate in balance sheet recessions or deleveragings [18].
If a deleveraging is handled well, the debt overhang takes between 7 and 10 years to clear.
Typically, deleveragings entail financial atonement by:
- Inflation (i.e. printing money to clear the debt burden) - since Zimbabwe has adopted a multi-currency framework, this policy option is not available to the nation. Further, the bulk of Zimbabwe's debt overhang is denominated in foreign currencies, which again, makes it impossible for the government of Zimbabwe to apply this policy.
- Financial Repression (i.e. artificially suppressing interest rates to clear the debt overhang, i.e. if the debt is local).
- Defaults and Debt restructuring to bring debt levels down to manageable levels.
- Wealth redistribution.
It is no surprise that deleveragings tend to coincide with periods of great societal upheaval; Hitler's ascendance was made possible by the politics of the post-WWI deleveraging in Germany!
Succinctly put, the consequences of deleveragings highlight that policy makers should always be mindful of rapid debt accumulation when they concoct policies.
***
Again, as I have alluded to elsewhere, ZimAsset will cost USD27 billion to implement. However, in the forthcoming analyses, I will use a policy cost of USD27 billion plus a margin of safety of USD500 million; i.e. a policy cost of USD27.5 billion.
In my analyses, I will consider ten broad debt scenarios. They are shown in Table 8 and 9:
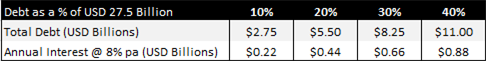 |
| Table 8 (click on table to zoom in) |
Table 9 is a continuation of Table 8:
| Table 9 (click on table to zoom in) |
To aid my analysis, I have formulated the following assumptions:

As Assumption 5. demonstrates, the analyses will assume total debt forgiveness.
In reality, Zimbabwe's debt overhang cannot be totally forgiven ― even if all her debts are wiped off. To expound; Zimbabwe's annual obligations to public sector pensioners are financed directly from the fiscal balance sheet. They are, in essence, debt coupons.
In 2013, Zimbabwe spent close to USD417 million on public sector pension obligations. If one assumes perpetually constant pension obligations, and, if one assumes that "Zimbabwean treasury securities" have an interest rate of 8%, the debt that is associated with pension obligations is approximately USD5.21 billion [19].
Otherwise put, Zimbabwe's government has a perpetual bond on issue. Interestingly, the face value of this bond accounts for 43.94% of Zimbabwe's projected 2014 GDP.
One can assert that Zimbabwe's public pension debt, is in essence, "external debt"; it is denominated in a currency that the Zimbabwean government cannot print. Further, given the pro-social leanings of Zimbabwe's governing elites, this debt essentially has a higher seniority in Zimbabwe's capital structure than Zimbabwe's "other" external debt.
In my analyses, I will ignore this pension debt.
***
To assess the sustainability of the debt scenarios that were shown in Tables 8 and 9, I will use simple debt indicators that are discussed in a report that was authored by the International Organization of Supreme Audit Institutions.
Table 10 expositions debt indicators, from two 'Global Optical Backstops', that will be used in the initial level of the analysis. It also expositions their thresholds [16]:
 |
| Table 10 (click on table to zoom in) |
Illustration 19, below, shows the vulnerability indicators under two financing scenarios; 10% debt and 20% debt:
 |
| Illustration 19 (click on illustration to zoom in) |
Illustration 19 demonstrates the following points:
- When evaluated using the Indebtedness to GDP ratio metric: Debt which is equivalent to 10% of ZimAsset's policy cost is at the uppermost limit of the International Debt Organization's threshold of debt sustainability in 2014. However, it progressively becomes more sustainable from 2015 to 2018. Interestingly, debt which is equivalent to 10% of ZimAsset's policy cost falls within the IMF's threshold of sustainability during the entire period under consideration.
- When evaluated using the Interest Payments to Government Revenues metric: Debt which is equivalent to 10% of ZimAsset's policy cost falls within the IMF's threshold of sustainability. However, it does not comply with the International Debt Organization's threshold of sustainability.
- Debt of 20%: It does not comply with both the IMF's and the International Debt Organization's standards of sustainability when evaluated using the two vulnerability metrics.
Hence, this illustrates that ZimAsset can be financed with a maximum debt of 10% of the policy cost. For the sake of transparency, I will exposition the debt sustainability under the remaining range of scenarios:
Illustration 20, below, shows the vulnerability indicators under two financing scenarios; 30% debt and 40% debt:
 |
| Illustration 20 (click on illustration to zoom in) |
As Illustration 20 shows, ZimAsset cannot be financed using debt of either 30% or 40% of the policy cost.
Illustration 21, below, shows the vulnerability indicators under two financing scenarios; 50% debt and 60% debt:
 |
| Illustration 21 (click on illustration to zoom in) |
As Illustration 21 shows, ZimAsset cannot be financed using debt of either 50% or 60% of the policy cost.
Illustration 22, below, shows the vulnerability indicators under two financing scenarios; 70% debt and 80% debt:
 |
| Illustration 22 (click on illustration to zoom in) |
As Illustration 22 shows, ZimAsset cannot be financed using debt of either 70% or 80% of the policy cost.
Illustration 23, below, shows the vulnerability indicators under two financing scenarios; 90% debt and 100% debt:
 |
| Illustration 23 (click on illustration to zoom in) |
As Illustration 23 shows, ZimAsset cannot be financed using debt of either 90% or 100% of the policy cost.
***
The vulnerability indicators clearly demonstrate that, at a borrowing cost of 8% per annum, Zimbabwe can fund only 10% of ZimAsset's policy cost using debt.
Naturally, this begs the following question: How would lower or higher borrowing costs affect the sustainability of ZimAsset?
To answer the question, GDP will be held constant at 2014 levels, and the vulnerability indicators that were presented in Table 10 will be computed for the following range of borrowing costs: 6%, 7%, 8%, 9%, 10%, 11%, 12%, 13%, 14% and 15%:
Illustration 24, below, shows the 2014 vulnerability indicators that are associated with different borrowing costs, when ZimAsset is financed using 10% debt:
 |
| Illustration 24 (click on illustration to zoom in) |
Illustration 24 demonstrates the following:
- When evaluated using the Public Indebtedness to GDP ratio: Under the IMF's debt sustainability standards, debt which is equivalent to 10% of ZimAsset's policy cost is sustainable in the entire range of interest rate scenarios. However, under the International Debt Organization's standards, debt which is equivalent to 10% of ZimAsset's policy cost is only sustainable with the following range of interest rates; 6%, 7% and 8%.
- When evaluated using the Interest Payments to Government revenues ratio: Under the International Debt Organization's debt sustainability standards, debt which is equivalent to 10% ZimAsset's policy cost, is only sustainable at an interest rate of 6%. However, under the IMF's standards, debt which is equivalent to 10% of ZimAsset's policy cost is sustainable with the following interest rates; 6%, 7%, 8%, 9% and 10%.
In aggregate, this exercise illustrates that debt which is equivalent to 10% of the policy cost of ZimAsset is only sustainable with the following interest rates; 6%, 7%, and 8%.
Illustration 25, below, shows the 2014 vulnerability indicators, for different borrowing costs, when ZimAsset is financed using 20% debt:
 |
| Illustration 25 (click on illustration to zoom in) |
Illustration 25 shows that ZimAsset is not sustainable if it is financed with debt equivalent to 20% of the policy cost (in any plausible interest rate scenario).
Hence, the scenario analyses indicate that ZimAsset is only sustainable when it is financed with 10% debt at a borrowing cost ranging between 6% and 8%. But what if additional debt sustainability metrics are used; what would the verdict be?
Table 11 has two additional vulnerability metrics; Debt Service to Income ratio and Debt to Income ratio. In Table 11 "Income" is just another term that is used interchangeably with "Government Revenue":
 |
| Table 11 (click on table to zoom in) |
The Cluster 1 debt sustainability metrics, in Illustration 26 below, were already discussed in the paragraph that immediately ensued Illustration 24. Thus, the discussion which immediately ensues Illustration 26 will center upon Cluster 2 debt sustainability metrics. It is important to note that GDP and government income are held constant at 2014 levels:
 |
| Illustration 26 (click on illustration to zoom in) |
Illustration 26 reveals the following:
- When evaluated using the Debt Service to Income Ratio: Debt which is equivalent to 10% of ZimAsset's policy cost doesn't conform with both the IMF's and International Debt Organization's standards. This holds for all interest rates from 6% to 15%.
- When evaluated using the Debt to Income Ratio: Debt which is equivalent to 10% of ZimAsset's policy cost doesn't conform with both the IMF's and International Debt Organization's standards. This holds for all interest rates from 6% to 15%.
Hence, using the analogy of the boiling frog, the debt scenarios can best be described in Illustration 27 as follows:
 |
| Illustration 27 (click on illustration to zoom in) |
- In scenarios where ZimAsset is financed with debt which is equivalent to 10% of the policy cost, there will be no immediately recognizable fiscal problems. However, problems will surface later on as the macro outlook changes.
- In scenarios where ZimAsset is financed with debt which is equivalent to 11% to 100% of the policy cost, there will be immediately recognizable fiscal problems.
Historically, Zimbabwe exhibited great resilience. For instance, during the late 1980s, Zimbabwe sailed far beyond the zone of insolvency until her Interest to Income ratio hit the 25% level (refer back to Table 11 for the recommended thresholds). This wasn't an unassisted feat; the country's fiscal staying power was largely buoyed by donor-subsidized public goods.
The debt sustainability metrics in Table 11 do not fully capture the insolvency dynamics of a country like Zimbabwe; they simply help to establish the point when fiscal problems emerge. Hence, it is prudent to supplement them with a reliable metric which features heavily in Rogoff and Reinhart's (2004-2010) work on debt sustainability; the Debt to Projected Government Revenue ratio:
Illustration 28 expositions ten debt scenarios:
 |
| Illustration 28 (click on illustration to zoom in) |
According to Reinhart and Rogoff (2004-10), countries:
- Start to experience fiscal problems when their Debt to Government Revenue ratio is 3-4 times. This corresponds with debt which is equivalent to 40% to 50% of ZimAsset's policy cost.
- Sail into the zone of insolvency when their Debt to Government Revenue ratio is at least 5 times. This corresponds with debt which is equivalent to 60% of ZimAsset's policy cost
This suggests that, with a reasonably-sized aid backstop, Zimbabwe can take on debt which is equivalent to 10% to 30% of ZimAsset's policy cost. However, as I have demonstrated elsewhere, there are very slim chances of getting such an aid backstop.
***
To sum-up, the analyses in this post reveal that ZimAsset will, in the highly unlikely best case scenario, be funded, over a five year period, as follows:
 |
| Table 12 (click on table to zoom in) |
Indeed, this creates the interesting conundrum of funding the balance; USD16.895 to USD17.965 billion. This balance translates to between USD3.379 and USD3.593 billion per year (i.e. figures that lie roughly between the FDI flows of Iraq and the Dominican Republic in 2012).
As Illustration 29, below shows, this shortfall translates to between 20% and 30% of Zimbabwe's projected GDP between 2014 and 2018:
 |
| Illustration 29 (click on illustration to zoom in) Adapted From: World Bank Data, ZimAsset Projections |
Theoretically, this shortfall could be supplemented by foreign direct investment (FDI) flows. However, in practice, it is highly unlikely that this shortfall will be fully financed through FDI.
From 1971 to 2012, Zimbabwe's FDI to GDP ratio averaged 0.84%, with a range of -0.45% ― it reached its lowest point in 1987 ― to 6.98% ― it reached its highest point in 1998. Hence, this simply shows that it is unrealistic to expect this shortfall to be met through FDI flows; Zimbabwe's FDI to GDP ratio has never been in the 20% to 30% range. And, there is nothing that has changed in recent times to expect it to average 20%-30% over the next five years.
If the FDI to GDP ratio bounces back, in the highly unlikely best case scenario, to its 1998 highs, one can expect ZimAsset to be funded over the 2014-2018 period as follows:
 |
| Table 13 (click on table to zoom in) |
Thus, this implies that in the highly unlikely best case scenario, there will be a funding shortflall of between USD12.09 to USD13.19 billion.
***
Through a process of axiomatic induction, it has become commonly accepted that Zimbabwe will grow and fund ZimAsset by:
- Following a policy of resource nationalism;
- Getting investors, preferably from the East, to invest in Zimbabwe's resource sector [26];
- Getting investors to cede 51% of their equity, and the rights that accompany it, to pre-vetted Zimbabwean partners;
- Getting investors to operate with much greater social responsibility.
At the turn of the millennium, the OECD had, on average, USD300,000-worth of known subsoil assets per square mile. Contrastingly, Africa had, on average, only USD60,000-worth of known subsoil assets per square mile. If one postulates that global geology is ramdomized, the average of Africa's known subsoil assets will, with the passage of time, approach the OECD average. [21] This simply implies that Africa is replete with untapped mineral wealth.
When mining companies bid to prospect for natural resource assets, they use the expected return principle. For instance:
 |
| Illustration 30 (click on illustration to zoom in) |
Illustration 30 shows two countries that are similar in every way; they have similar Political, Economic, Social and Technological and Legal and Environmental conditions. The only difference; in Country A, the investor is expected to cede 51% of the equity of the mining venture to locals, in Country B, the investor can own 100% of his or her resource find. The probability of finding a USD100 million natural resource asset on each claim is 0.5.
If one ignores the downside probabilities and their associated costs, the expected returns of the resource finds in each country can be computed as follows:
- Expected Return of Country A resource find = USD100 million * 0.5 * 0.49 = USD24.5 million
- Expected Return on Country B resource find = USD 100 million * 0.5 = USD50 million
All things being equal, the rational investor would commit capital to the mining opportunity in Country B.
***
As I have alluded to before, the uptrend in global commodity prices, which occurred since 2002, was largely driven by the infrastructure investment boom which was occurring in China (refer back to Illustration 15). Currently, there are strong indications that this investment boom has reached its limits; a longterm pullback in global commodity prices may be imminent. Otherwise put; the returns from investing in mining ventures may be on a secular downtrend.
Between 2012 and 2013, there was USD350 trillion in global credit against total global GDP of USD60 trillion. The Total Global Market Credit to Total Global Market GDP ratio stood at 350%. According to Kyle Bass of Hayman Capital Management ― a sovereign balance sheet authority in his own right ― 2008 marked the beginning of the end of a global debt super-cycle.
Interestingly, the defining feature of this global credit unwind can be abbreviated as follows: different countries would go through the deleveraging process at unique points. Fundamentally, when credit contracts, capital to invest in mining opportunities dwindles.
To recap quickly, globally;
- The demand for commodities is on a downtrend.
- Capital to invest in mining opportunities is dwindling.
When the above mentioned factors are juxtaposed with Africa's untapped resource wealth, USD240,000-worth of unexploited subsoil assets per square mile, one can conclude that, going forward, African countries will be competing fiercely for mining investors.
Clearly, ceteris paribus, in the prevalent macro environment, an investment policy that is predicated on the notion of resource nationalism would prejudice Zimbabwe of much needed investment. That is, unless Zimbabwe does the following:
- Invest in generating geological knowledge, and, in building a database of her subterranean assets. This would increase an investor's probability of finding a resource asset on a claim, which would, in turn, increase the expected return of resource find.
- Reduce mining royalties. This would help to: 1) Increase the expected return of resource finds, and; 2) Increase the profitability of the equity stakes that are ceded to Zimbabwean communities.
These recommendations are best illustrated by way of a hypothetical example:
 |
| Illustration 31 (click on illustration to zoom in) |
The key differences between the scenarios in Illustration 30 and Illustration 31 are:
- Country A invested in resource exploration activities and built a database of her subterranean assets.
- Country A scrapped mining taxes. They were no longer relevant; her citizens directly benefit from equity stakes in mining vehicles and from supply contracts to mining firms.
- Country B has a mining tax of 25%.
If one ignores the downside probabilities and their associated costs, the expected returns of the resource finds in each country can be calculated as follows:
- Expected Return of Country A resource find = USD100 million * 0.8 * 0.49 = USD39.2 million
- Expected Return of Country B resource find = USD100 million * 0.5 * 0.75 = USD37.5 million
To close off, this simple exercise shows that it is theoretically possible for Zimbabwe to maintain her resource nationalism policy without adversely impacting the attractiveness of her mining sector. This can be done via: 1) Fiscal creativity, and; 2) Heavy investments in resource exploration activities and in building resource databases.
[1] In the short term, wealth redistribution can only generate economic growth by transferring wealth from groups that have a low marginal propensity to consume to groups that have a high marginal propensity to consume. Conversely, this implies transferring wealth from groups that have a high marginal propensity to save to those that have a low marginal propensity to save, which would, ceteris paribus, reduce the nation's savings rate, capital formation and the efficacy of financial intermediation.
[2] In their paper which is titled "Does Market Liberalization Increase Total Factor Productivity: Evidence from the Manufacturing Sector in Zimbabwe" Bjurek and Durevall (1998) present a narrative which describes the history of Input Substitution in Zimbabwe and the economic dynamics it spawned. Here it is:
"As a response to international sanctions, imposed in 1965, the regime of Rhodesia introduced widespread controls on both external and internal trade. At independence in 1980, the new Government thus inherited a highly controlled economy. During the rest of the decade most of these controls were maintained. In practice, the policy was one of import substitution (IS) similar to that of many other developing countries.
The centerpiece of the IS policy was regulation of foreign trade. All foreign exchange earnings and capital inflows had to be surrendered to the Reserve Bank, and the distribution of foreign exchange to importers was mainly done administratively through the Direct Local Market Allocation (DLMA). Companies were allowed to apply twice a year for the right to import certain goods and services. The DLMA worked as a system of import quotas where the size of the quotas varied over time. One consequence of the DLMA was that once companies were in the system they could be quite certain to continue receiving foreign exchange allocations. The reason was that imported inputs are required for production so removing companies from the DLMA for a year would have had devastating effects on the manufacturing sector. Since there by definition was a shortage of foreign exchange, this made entering the DLMA quite difficult. As a result there were relatively few firms entering and exiting the manufacturing sector, making turnover-based productivity gains small or nonexistent.
Since practically all investments in Zimbabwe require imported capital goods, a consequence of the import controls was that the authorities effectively controlled investments as well. In view of the excess demand for foreign currency generated by the IS strategy, the only sensible investment policy was to channel import licenses to a limited numbers of producers of each type of good. This resulted in the creation of a number of oligopolistic and monopolistic markets; in mid-1980s about 50% of all goods manufactured in Zimbabwe were produced by one company and 80% by three companies or less (UNIDO 1986). Hence, Zimbabwean producers were not only protected from international competition but also from domestic competition.
To restrain firms from taking advantage of their market power, price controls were widely used. These were in general based on cost-plus, and permissible margins were gazetted. An implication of the price controls was that for many firms higher costs meant higher profits in dollars. Selling the goods was usually not a problem because rationing generated excess demand. The economic structural adjustment program was launched at the end of 1990. Two of its major components were trade liberalization and deregulation of domestic markets. Government control over allocations of foreign exchange and import licenses was to be dismantled gradually over five years by sequentially putting import goods on an Open General Import License (OGIL) list; such goods could be imported in any quantity without import permits. However, the original plan was altered after a couple of years and OGIL was replaced by the Export Retention Scheme (ERS) as the main policy instrument. The ERS allowed exporters to retain part of their export earnings in the form of import certificates and sell these at a market-determined price. During the course of the reform the foreign exchange allocations were reduced, and in January 1994 the DMLA, ERS, and OGIL were all abolished. Since then the exchange rate has been determined largely by market forces, although with occasional interventions by the Reserve Bank.
The creation of a foreign exchange market implied that restrictions on domestic demand for imports disappeared, and that local companies became exposed to foreign competition. Nevertheless, some protection remained in the form of import tariffs, although they had played a minor role before liberalization. The average tariff rate was only about 20%, but the structure was complicated and the maximum rate was 90% (for cars). In addition there was an import surtax of 20% (RPED, 1993). Apart from a reduction in the surcharge to 10% in 1994, there was little advance in tariff reform until 1997 when a new tariff system was introduced with the aim of removing distortions in the old regime.
The deregulation of the domestic markets included removal of the price controls in the goods market, reduction of government’s involvement in wage setting and introduction of new labor regulations making it cheaper and easier to retrench employees, and liberalization of the financial markets. Substantial progress was made in all these areas: Almost all price controls were abolished during the first years of ESAP. The labor market underwent profound changes already in 1990, as wages in general became determined by collective bargaining and retrenchment no longer required ministerial approval (Ncube, 1998). And in the financial markets, the majority of the interest rates were deregulated already by 1991."[3] This is particularly true for the Results Based Management approach.
[4] Illustration 5 is an adaptation of a change model that was developed by Perich (1992). Basically, a movement from the stable state in point a to the stable state in point c occurs via gradual small increments over a long period of time. This contrasts with the movement from the stable state in point a to the dynamic state in point c which can only occur through big bang changes. Evidently, the ZimAsset change initiatives are depicted by the latter movement; i.e. the movement from point a to the dynamic state in point c.
[5] There is nothing anomalous about the demands that war veterans made. During the Great Depression, the 17,000-strong Bonus Army of World War I veterans made similar demands in the US.
[6] The Zimbabwean President's office is the architect of the ZimAsset vision; it is the change agent.
[7] For more information on resource capabilities see: Barney, J. B., (2001a) ‘Is the resource-based 'view' a useful perspective for strategic management research? Yes’. Academy of Management Review, 26(1): 41-56.; Grant, R.M. (1991) ‘The resource –based theory of competitive advantage: Implications for strategy formulation’. California Management Review, Spring: 114-135.; Grunert, K. G., & Ellegaard, C. (1992) The concept of key success factors: theory and method. MAPP.
[8] I believe that Zimbabwean civil servants should be granted the salary increment that they desire. However, the salary increment should not be granted unconditionally; the base salary, once hiked, should be indexed to inflation, and, it must be linked to unambiguous performance targets. Further, Zimbabwean civil servants should agree to a policy where the bottom 10% is "transitioned-out" of civil service annually for the next five years. That would allow the total headcount in civil service to halve by 2018, and it would bring expenditures on civil servant wages to 35% (from 70%) of the 2014 budget by 2018.
[9] My former Professor for Leadership and Change, Dr. Bernd Vogel, describes organizational energy as: the "force which an organisation uses to purposefully put things in motion". He precisely describes organisational energy as: "the extent to which an organization, department, team has collectively mobilized its emotional, cognitive, and behavioral potentials in pursuit of its goals".
[10] How can this be achieved? According to Bernd Vogel, Corrosive Energy can be addressed in the following way:
"Our research shows that it is nigh on impossible to truly transfer interpersonal aggression, in fighting, and internal rivalries directly into productive energy because of the betrayal that might have taken place or the high levels of mistrust amongst people. Leaders instead need to engage in a two-step process that we call ‘energetic refocusing’: first, ‘phasing down’ negativity, and second, ‘charging up’ the company again by building a strong organisational identity and purpose".
"Ask yourself if your organisation has the leadership capability to pursue the three crucial leadership instruments for the step of ‘phasing down’:
- Creating ‘release valves’ for letting off steam.
- Instigating emotional shakeups to cut though vicious circles of anger and ongoing destructive conflicts.
- Identifying and supporting toxic handlers (Frost and Robinson 1999) who absorb the negative forces from people across the company".
"Only when corrosion has calmed down in the organisation, then executives can or must think about ‘charging up’ and ‘re-igniting’ the organisation to prevent corrosion from emerging again. But then it needs an explicit investment in positive behavioral norms and attitudes or people fall back in old patterns and negativity will re-surface."[11] Aid flows were converted to, and, are expressed as 2009 USDs.
[12] Estimates were drawn from a presentation that was delivered by Kyle Bass, of Hayman Capital Management.
[13] The growth rates are in Table 1 of the ZimAsset document (page 28).
[14] Estimates were drawn from a presentation that was delivered by Jim Chanos of Kynikos Associates.
[15] Estimates were drawn from a Pivot Capital Management 2009 report titled China’s Investment Boom: the Great Leap into the Unknown.
[16] The term 'Global Optical Backstop' was coined by Kyle Bass of Hayman Capital Management. It refers to the supranational institutions, like the IMF, that were created to help countries with balance sheet problems. The word "optical" in this context implies that these institutions don't actually have reserves as they appear to (in the traditional sense). Nations pledge to make contributions that are drawn upon / actually contributed as and when they are needed.
[17] According to Carmen Reinhart, in a deleveraging, the bad debts of the banking sector are transferred to the public balance sheet; there is a blur between public debt or private debt. And, this elevates sovereign debt. Thus, it is reasonable to expect the Debt to GDP ratios of Eurozone countries, including the Euro's center of moral rectitude - Germany, to grow. This morphs a financial crisis into a fiscal crisis, which takes, on average, 7 years to clear.
[18] To learn more about deleveragings, visit www.economicprinciples.org
[19] Using the simple perpetuity calculation, the value of the debt can be calculated as follows ($417 million/ 8%). During the days of the GNU, foreign banks that operate in Zimbabwe pledged to purchase government debt at a yield of 8%. This caused friction between the foreign banks, and, the then finance minister of Zimbabwe, Tendai Biti.
[20] First class jobs gravitate towards first class infrastructure.
[21] Paul Collier makes mention of this fact in most of his talks.
[22] This article from Zimbabwe's Newsday daily illustrates the point clearly; China cannot commit funds.
[23] This quote, from Reinhart and Rogoff's paper titled 'From Financial Crash to Debt Crisis' illuminates the direction of the relationships better: "External debt surges are a recurring antecedent to banking crises. Banking crises (both domestic and those emanating from international financial centers) often precede or accompany sovereign debt crises".
[24] I think it was Kindelberger who once stated that: "The supply of corruption increases in a pro-cyclical way much like the supply of credit. In the absence of more credit, the fraud sprouts from the woodwork like mushrooms in a soggy forest". Here is a leading indicator of problems in China's local government sector that Pivot Capital Management discussed in its 2011 report which is titled China's Investment Boom and Pending Bust: "According to a PBoC report that was mistakenly published and then quickly retracted by the authorities, in the period between 1993 and 2008, 16,000-18,000 local government bureaucrats and managers fled China, embezzling as much as USD 124 billion out of the country. We can only imagine how much more has been stolen in the past 3 years, given the scale of lending to local governments. Theft played a major part in the misallocation of capital that occurred in the Chinese economy in the past three 2 years."
[25] Risk: If you look across the sweep of history, senior civil servants, i.e. upper middle class people who are on the immediate peripheries of the core establishment, have been the people who tended to start revolutions, e.g. Maximilien de Robespierre. Thus, it is reasonable to assert that the discontent of senior civil servants could be, in the worst case scenario, a distabilizing factor.
[26] According to an article which was published in the Financial Times on the 6h of February 2014, Wang Jiahua, vice-president of the Chinese Mining Association, stated that in the past decade, 80% of the mining investments, that were made by Chinese investors in Africa, failed.
[27] Estimates have been obtained from a 2011 Pivot Capital Management report which is titled China's Investment Boom and Pending Bust.
[28] The great prophet of statecraft, Machiavelli, once said: "Always be flexible; God's greatest gifts are broken campaign promises". (He didn't exactly say that - that's just a modern interpretation of his writings).