"If we use the word 'genocide' and are seen as doing nothing, what will be the effect on the November [congressional] election?"
― Susan Rice (1994 National Security Council Advisor), 1994 NSC Call
“The truth will set you free, but first it will piss you off.”
― Gloria Steinem
"All truth passes through three stages. First, it is ridiculed. Second, it is violently opposed. Third, it is accepted as being self-evident."
― Arthur Schopenhauer
In his 5th of April 2014 interview with Jeune Africa Magazine, Mr. Paul Kagame, the current President of Rwanda, said and I quote [1]:
“The Western powers would like us to believe that Rwanda is an ordinary country; as if nothing ever happened [8]. This accords them the space to forget and distance themselves from their responsibilities, but it is impossible. A case in point is France. Twenty years after the genocide, the only thing we can tell the French to their faces is that they did not do enough to save lives during the genocide. This is a fact, but it glosses over the reality. Belgium and France played a direct role in the political preparation of the genocide and they participated in the genocide. Ask the survivors of the massacre that occurred in Bisesero in June of 1994 and they will tell you that the French soldiers, who were part of Operation Turquoise, did it.”
Before I explore the merits of the accusations that Mr. Paul Kagame leveled in the italicized sections of the quotation, I will start by discussing the context:
By all accounts, France's track record on the African continent is checkered, at best, and inordinately flawed, at worst. Otherwise put, it is very easy to ― rightfully or wrongfully ― link France to any nefarious activity that occurred in Francophone Africa; the defining feature of France's Africa Foreign policy was/is its ruthless amorality.
Generally, during the period which intervenes (Valéry Giscard) d’Estaing and (Jacques René) Chirac's terms in office, France's Africa Foreign policy was predicated upon the following broad aims:
- Maintaining France's control over the political and cultural spheres of Francophone states, with the underpinning goal of;
- Maintaining and expanding France's control over the economic and financial spheres of Francophone states.
To protect her interests in Africa, France forged military allegiances with the governments of virtually all Francophone states, including the government of Juvénal Habyarimana (in 1975).
When the Rwandan Patriotic Front (RPF) invaded Rwanda in 1990 ― i.e. four years before the Rwandan genocide occurred ― it threatened the contemporary geopolitical alignment, which buttressed France's Rwandan interests. Otherwise put, the attack on the Habyrimana government was tantamount to an attack on France.
***
...Four Years Before the Genocide Occurred: Invasion by Ugandan-Sponsored RPF Forces
"There are no 'good guys' in this story"
When the Ugandan-Sponsored RPF invaded Rwanda in 1990, it managed to bring large swathes of territory in North Western Rwanda under its fold. From the vantage point of the commune chiefs in the region, the RPF's push towards Kigali had immense chances of success. Owing to this belief, they cast their lot with, and lent their support to, the RPF. Succinctly; it was a forgone conclusion that the Rwandan Defense Forces (FAR) could not match then invading RPF in combat. And, that the RPF would march to Kigali unopposed.
In a bid to protect her interests and aid a pliant ally, France intervened militarily in the conflict and helped to bring the RPF's advance to a grinding halt. During the ensuing period, i.e. while the Arusha Accords were being negotiated and signed, France, in accordance with the terms of her military alliance with the Rwandan government, gave basic military training to a youth reserve force. Unbeknownst to France at the time, this youth reserve force would evolve into the Interahamwe; the militia that would execute the genocide in 1994.
Otherwise put, France did, as Paul Kagame suggests, help to prepare for the genocide (albeit indirectly). Her military trained the Génocidaires. However, it is important to point out that there is no credible evidence which suggests that France trained the Génocidaires with the intent to bolster their capabilities to commit acts of genocide.
Rather, all the evidence in the public domain suggests that she trained the Génocidaires with the intent to bolster their collective ability to thwart, what was theretofore, widely perceived as a foreign-sponsored invading force (which sought to depose, via violent means, a legitimately elected government).
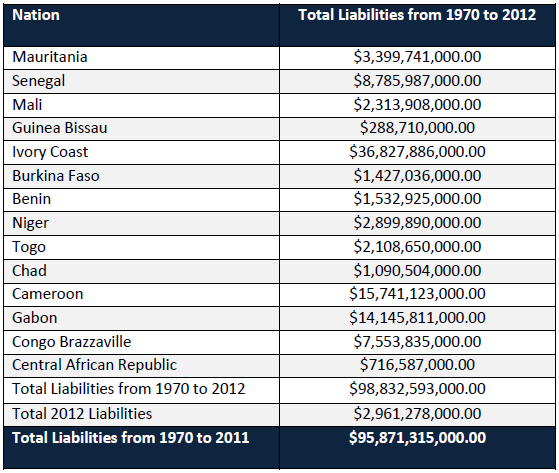
Further, the military training that France gave to the-said youth reserve force was part of an ongoing military collaborative relationship between France and Rwanda. This collaborative relationship was/is permissible under international law, and, is analogous to the relationship that France has in place (since 1960) with; Mauritania, Senegal, Mali, Guinea Bissau, Ivory Coast, Burkina Faso, Benin, Niger, Togo, Chad, Cameroon, Gabon, Congo Brazzaville and the Central African Republic.
...On whether France participated in the Genocide
I think that the most serious aspect of Mr. Paul Kagame's allegation is the suggestion that French troops participated in the 1994 Rwandan Genocide.
To explore the merits of this allegation, it is prudent to start by determining when French troops were in Rwanda and when they "left". The abbreviated timeline in Illustration 1, below, will aid this endeavor:
 |
Illustration 1 (click on
illustration to zoom in) Adapted From: UN Independent
Inquiry, 1999, and; Soderlund
et al., 2008
|
As Illustration 1 shows, prior to the 14th of April 1994, French troops were part of the
UNAMIR peacekeeping force which was mandated to oversee the
implementation of the Arusha Accords [6]. After
a contingent of Belgian peacekeepers was executed by members of the
Rwandan Presidential Guard, i.e. on the 7th of April 1994, France was compelled to shift her priorities
from peacekeeping to the evacuation of French nationals and troops.
Between the middle April of 1994 and the 22nd of June 1994, this para-battalion force was dormant. Otherwise put, the battalion did not provide the UNAMIR peacekeeping force with any form of assistance. According to all indications, the "para-battalion" force did nothing during the captioned time period.
Thus, this suggests that French troops cannot be held to account for (committing) the atrocities that occurred after the 15th of April 1994 and before the 23rd of June 1994.
As Illustration 1 shows, on the 23rd of June 1994, a contingent of 2,550 French troops and 500 troops from Senegal, Guinea-Bissau, Chad, Mauritania, Egypt, Niger and the Republic of the Congo arrived in Rwanda.
They were mandated, by the UN, to establish a "safe-zone" in the South Western region of Rwanda. This mission was christened, by the French, Operation Turquoise. And, it was under the command of General Jacques Hogard.
They were mandated, by the UN, to establish a "safe-zone" in the South Western region of Rwanda. This mission was christened, by the French, Operation Turquoise. And, it was under the command of General Jacques Hogard.
***
To recap: In the quote that opened this post, Mr. Paul Kagame alleges that the French contingent of Operation Turquoise helped the Génocidaires, sometime in June of 1994, to commit the callous atrocities that occurred in the Bisesero region of Rwanda.
In the forthcoming sections of this post, I will use reconnaissance satellite image data on battle-front positions, and, records of the atrocities that occurred during the Rwandan genocide to explore whether Mr. Kagame's allegation has any merit.
In the forthcoming sections of this post, I will use reconnaissance satellite image data on battle-front positions, and, records of the atrocities that occurred during the Rwandan genocide to explore whether Mr. Kagame's allegation has any merit.
***
Paul: “Yes, General. I am glad you came by. I overheard something that I think you should know about.”
General Bizimungu: “What did you overhear?”
Paul: “A discussion between an American Embassy official and a UN Colonel.”
General Bizimungu: “What did they say?”
Paul: “The American assured the colonel that they would watch everything.”
General Bizimungu: “Watch everything? How? They are gone.”
Paul points surreptitiously to the sky. The General looks up.
Paul: “Satellites.”
General Bizimungu: “Satellites?”
Paul: “Yes, they can photograph the epaulets on your shoulder.”
General Bizimungu: “And what will they do with these satellites?”
Paul: “The American said intervention is too costly, better to get photographic evidence and snatch up the high command.”
General Bizimungu: “The high command? Our high command?”
Paul: “'Snatch them up and put on a war crimes trial. Lock them all away forever. No political risk, and big publicity.' That's what he said… I thought I'd better tell you.”
The General looks again to the sky then.
General Bizimungu: “The Americans! Who are they to put us on trial?”
― Exchange from the 2004 Historical Drama Film, Hotel Rwanda
The first challenge I faced was to identify exactly where Bisesero was situated. To aid my endeavor, I consulted the Great Oracle of our modern age, Google Maps. Illustration 2 sums-up what I discovered:
 |
| Illustration 2 (click on illustration to zoom in) Adapted From: Google Maps, 2014 |
I soon discovered that Bisesero was a mountain range in Rwanda, which is in the vicinity of the following locales; Kibuye, Gisovu and Gishyita.
In this post, the Bisesero Massacres will be taken as any massacre that occurred, in June of 1994, within a 10 mile or 16.10 kilometer radius of Gisovu, i.e. the marked spot in Illustration 2.
After I had located Bisesero, I then faced the following challenges:
- Locating a dataset of the atrocities that occurred during the Rwandan genocide. I needed a dataset that would stipulate where an atrocity occurred, who the perpetrators were and when it occurred, i.e. an event catalogue.
- Locating a dataset of the battle-front, troop movements and the territory that was controlled by the RPF, the FAR and the Operation Turquoise Force.
Otherwise put, I was looking for an integrated dataset with four dimensions; 1) Killings, 2) Geography, 3) Battle-Fronts / Troop Movements and 4) Time.
Interestingly enough, there is only one research project in the world that built the four-dimensional dataset that I sought; the Genodynamics project that was spearheaded by Professors Allan Stam and Christian Davenport.
From the outset, I have to point out that the project is inexorably controversial in certain circles [2] [9]. The controversy does not stem from the methodology that was employed to collect the data. It largely stems from the conclusions that the researchers drew from the data.
When one uses a dataset that underpins the controversial conclusions of a research project, like the one that was conducted by Professors Allan Stam (Stam) and Christian Davenport (Davenport), it is important to be transparent on the aspects of the research findings that will or will not be used [9].
Table 1 expositions the seven dimensions of the Genodynamics project (I will not discuss most of the things that are shaded in grey):

In this post I will use the dimensions of the Genodynamics project that attract limited controversy, including; 1) Nature of the Killings, 2) Types of the Killings, and 3) The Perpetrators of the Killings.
***
Before I explore the merits of the allegations that were leveled by Mr. Paul Kagame, I'll start by briefly discussing how the data that underpins the Genodynamics project was collected. With this specific research project, it is of critical importance to be transparent:
Illustration 3 shows the data sources that were used to construct a database of the atrocities that occurred during the Rwandan Genocide:
 |
| Illustration 3 (click on illustration to zoom in) Adapted From: Stam, 2009, and; Davenport, 2010 |
As Illustration 3 shows, the killings database of the Genodynamics project was primarily built using:
- Ten sources of data.
- Both Rwandan sources and International sources.
- Datasets that covered both large scale killings and the (other) killings that occurred throughout Rwanda.
The principal sources of data that will be used in this particular post to establish the killings that occurred in Rwanda during the 1994 Genocide include:
- The Rwandan Ministry of Education: The Rwandan Ministry of Education conducted a house-to-house survey to establish the number of killings that occurred in each prefecture.
- The Rwandan Ministry of Youth, Culture and Sport: Conducted a mass-grave identification programme. The exercise identified a total of 130 mass-graves. Davenport and Stam visited a sample of 85 out of the 130 mass-grave sites to verify whether they existed or not. [3]
- Ruzibiza Deposition.
- Physicians for Human Rights: Exhumed one of the mass-graves to identify if the remains in the mass-graves corresponded with the reported totals. [4]
- Human Rights Watch: Collected 12,000 witness testimonies. These testimonies were used, in the Genodynamics project, to establish exactly when the killings in each region began.
Like the Genodynamics flagship presentation, this post will use a median estimate of the casualties that were reported by all five of the above-mentioned sources. Otherwise put, the killings that were not reported by all five sources will not be considered.
To establish the battle-fronts and the territories that were controlled by RPF, FAR and Operation Turquoise, Davenport and Stam used the following five step methodology:
- Acquire Reconnaissance Satellite Data: The Canadian Military had reconnaissance satellites that were monitoring troop positions in Rwanda during the entire duration of the genocide. Davenport and Stam obtained this reconnaissance satellite imagery and used it as a starting point; [5]
- Verify Troop Positions Using US Defense Intelligence Estimates: The authors verified the troop positions that were captured by the reconnaissance satellites using de-classified US Defense Intelligence estimates;
- Verify Troop Positions Using CIA National Intelligence Estimates: They obtained, through the Freedom of Information Act, the troop positions of each side in the conflict. Using the de-classified CIA National Intelligence estimates, they verified the troop positions;
- Verify Troop Positions Using Kuperman's Estimates: They revised the data to incorporate the troop positions that underpin the treatise which Professor Alan J. Kuperman presents in The Limits of Humanitarian Intervention: Genocide in Rwanda.
- Verify Troop Positions Using Combatant Accounts: Davenport and Stam's research collaborator, Professor Peter Erlinder, an International Criminal Tribunal for Rwanda defense lawyer iteratively discussed, separately of course, the battle-front and territory data that his team had collected with RPF members (see Map 1, Map 2, Map 3 and Map 4 here), the UN and members of the FAR. He incorporated their feedback into the template that his team had built.
Hence, it is reasonable to assert that the troop position, battle-front and territory data that will be used in this post represents: 1) the opinions of the principal players in the conflict, and; 2) the intelligence that was gathered by US and Canadian governments.
When Davenport and Stam collected the data, they discovered that there wasn't much variance between the troop positions that were declared by all the sources.
***
To help interpret the information in the Illustrations that will follow, here is a rough key:
- A zone which is shaded in Green: Was under the control of the Rwandan Patriotic Front (RPF) on the given date.
- A White zone: Was under the control of the Rwandan Defense Forces (FAR) or the Interahamwe on the given date.
- A zone which is shaded in Turquoise: Was under the control of the French Army on the given date.
- A solid Green line or edge: Indicates the RPF's battlefront on the given date.
- A solid Blue line or edge: Indicates the French's battlefront on the given date.
- Orange shading: Indicates that an atrocity occurred in the prefecture on the given date. The deeper the shade of orange; the greater the number of killings.
Further the atrocities that occur:
- Along the Battlefront: Are defined as Combat Deaths.
- Behind the Battlefront: Are defined as Reprisal Killings, Politicide or Random Killings.
***
As I alluded to before, French Operation Turquoise troops officially set foot in Rwanda on the 23rd of June in 1994. However, as Illustration 4 clearly demonstrates, the French did not have any battle-front position on the date:
 |
| Illustration 4 (click on illustration to zoom in) Adapted From: Davenport and Stam, 2004 [7] |
The only massacre that occurred in the target region (refer back to Illustration 2), occurred in Kibuye; i.e. in the territory that was controlled by the FAR.
Illustration 5, below, shows, a massacre that occurred in Rwanda on the 24th of June 1994:
 |
| Illustration 5 (click on illustration to zoom in) Adapted From: Davenport and Stam, 2004 |
As Illustration 5 demonstrates, the French did not have a battle front position on the date; the massacre occurred in FAR-controlled territories.
Illustration 6, below, shows two massacres that occurred in Rwanda on the 27th of June 1994:
 |
| Illustration 6 (click on illustration to zoom in) Adapted From: Davenport and Stam, 2004 |
Of the two massacres, the killings that occurred in the commune near Kibuye fall in the target region (refer back to Illustration 2). However, they occurred in a territory that was controlled by the FAR; the French did not have any battleground position on the date.
Illustration 7, below, shows a massacre that occurred in Rwanda on the 28th of June 1994:
 |
| Illustration 7 (click on illustration to zoom in) Adapted From: Davenport and Stam, 2004 |
As Illustration 7 shows, the massacre occurred in the target region (refer back to Illustration 2). However, the French did not have any battleground position on the date.
***
To close off, according the data at hand, the French did not have any battleground positions during the entire month of June.
From the data, one can deduce the following: Between the 23rd and the 30th of June 1994, French troops were probably establishing a base, securing the perimeter and sending off reconnaissance scouts to probe the area.
Otherwise put, the French did not have command control over the regions wherein the massacres (that Kagame cites) occurred. Thus, it is reasonable to assert that the FAR was probably responsible for the killings that occurred during the month of June 1994.
This does not imply that Mr. Paul Kagame made a baseless allegation; it simply suggests that: he may have based his allegation on witness accounts that have inaccurate dates, or, that the battle front data that I used does not fully capture the dynamics of the battleground. Or, maybe he is correct; there was a French para-battalion that was stationed in Kigali when the genocide occurred. Could the para-battalion have committed the-said atrocities?
***
According to the data, the French only had a discernible battleground position in Rwanda on the 4th of July 1994 as Illustration 8, below, shows:
 |
| Illustration 8 (click on illustration to zoom in) Adapted From: Davenport and Stam, 2004 |
Illustration 8 clearly shows that killings occurred along the French-FAR battlefront on the 4th of July 1994. These killings occurred in the target zone (refer back to Illustration 2).
Technically, the-said killings cannot be defined as genocidal killings because they occurred along the battlefront. However, given the allegations that Mr. Paul Kagame leveled, it would be wise to conduct a detailed investigation into: the nature of the killings that occurred on the 4th of July 1994 and the perpetrators of the atrocities.
Illustration 9, below, depicts atrocities that occurred in Rwanda on the 17th of July in 1994:
 |
| Illustration 9 (click on illustration to zoom in) Adapted From: Davenport and Stam, 2004 |
As Illustration 9 clearly demonstrates, the killings occurred in the Turquoise Zone, i.e. a zone that was under the territorial jurisdiction of the French. This zone lies behind the French-FAR battle-front. And thus, the killings could either be defined as Genocide, Politicide, Reprisal Killings or Random Violence.
Approximately 85 lives were lost in this incident.
Clearly, it is important to stress that the existence of the 17th of July 1994 killings lends credence to the allegations that Mr. Paul Kagame leveled; the French had command control over the region wherein the killings occurred.
Thus, it would be prudent to conduct further investigations to establish:
- The contextual factors.
- The nature of the killings.
- The perpetrators of the atrocities.
Meaningful reconciliation can only occur in Rwanda when all the unpleasant truths are known.
[1] Be advised this is an English Translation of a French Translation of an interview that Mr. Paul Kagame gave in English. Otherwise put, it isn't a verbatim quotation. However, it should accurately capture the gist of Mr. Paul Kagame's statement.
[2] The principal collaborators in the project, Davenport and Stam, were both declared persona non-grata in Rwanda. Because of the misinterpretation of his research conclusions, Christian Davenport was harassed and he (and members of his family) received numerous death threats. Further, Peter Erlinder, a UN International Criminal Tribunal for Rwanda Defense lawyer, author and research collaborator on the project, was arrested and tried in 2010 for "promoting genocide ideologies" and for links to the FDLR, i.e. the Génocidaires. Owing to this episode, Peter Erlinder suffers from Post Stress Traumatic Disorder (PSTD). Generally, all the members of this research projected were savagely attacked and vilified by the Rwandan Public Relations Machine.
[3] The site visits positively verified the existence of all the 85 mass graves in the sample.
[4] The exercise confirmed that the declared cadaver count in the mass grave tallied with the actual number of remains in the mass grave.
[5] It took Davenport 3 years to obtain that reconnaissance satellite footage.
[6] It is important to stress that the force did not have the mandate to engage in combat.
[7] As Illustration 4 clearly shows, the data suggests that the RPF, i.e. Mr. Kagame's army, conducted reprisal killings near the commune of Gitarama on the 23rd of June 1994. In aggregate, the data provides prima facie evidence for a total of 1,683 RPF Reprisal Killings. Otherwise put, the data suggests that there are no pure knights in shining armor in this story. A verbatim quote that helps to explain why no one talks about this: "We used communication and information warfare better than anyone.We have found a new way of doing things." ― Mr. Paul Kagame (Source of Quote: Gowing, N., (1998) ‘New challenges and problems for information management in complex emergencies: ominous lessons from the Great Lakes and eastern Zaire in late 1996 and early 1997’. Paper presented at Dispatches from Disaster Zones conference, Oxford)
[8] This is clearly an instance of the use of the 'narrative of difference' that Van Leeuwen (2001) wrote of in ‘Rwanda’s Imidugudu programme and earlier experiences with villagization and resettlement in East Africa’, Journal of Modern African Studies 39 (2001), pp. 623–44.
[9] For an abbreviated and easily digestible narrative of Davenport and Stam's (2010) research findings read: What Really Happened in Rwanda?