"There is an element of delusional obsession in the French political elite's preoccupation with the notion that France is still a global power."
― Zbigniew Brzezinski (Carter Administration Advisor), The Grand Chessboard
“Without Africa, France will slide down into the rank of a third [world] power”
― Jacques Chirac (French President 1995 - 2007), March 2008 Speech
"There is a dismal record of failure in Africa on the part of the developed world that shocks and shames our civilization."
― Tony Blair (UK Prime Minister 1997 - 2007), Trying to Feed a Billion People
”Without Africa, France will have no history in the 21st century”
― François Mitterand (French President 1981 - 1995), Speech
“The tragedy of Africa is that the African has not fully entered into history ... They have never really launched themselves into the future. The African peasant only knew the eternal renewal of time, marked by the endless repetition of the same gestures and the same words. In this realm of fancy ... there is neither room for human endeavor nor the idea of progress."
― Nicholas Sarkozy (French President 2007 - 2012), Dakar University Speech
From the 2nd to the 3rd of April 2014, delegates from 65 African and European states will converge, at the 4th EU-Africa Summit in Bruxelles (Belgium), to discuss the following pertinent topics:
- Education, Training and Human Capital Development.
- Inter-Continental Flows of Documented and Undocumented Migrants.
- Economic Growth and Employment Creation.
- Peace and Security.
It is reasonable to assert that this transnational gathering of policy-makers will spawn initiatives that target to improve the well being of Africans. However, by and large, most of these initiatives will fail to achieve their envisaged end-states. Why? Because their architects will fail to meaningfully explore the root causes of the problems that bedevil some African nations.
For instance, some of the economic ailments that affect Francophone African states have their origins in an agreement that was signed by France and her African colonies before they attained their independence in 1960. This agreement is known as the second Colonial Pact or, in polite quarters, as Françafrique.
Essentially, the agreement has eleven facets that are discussed extensively in the following seminal texts:
- Colonialism in Africa, 1870-1960: The Economics of Colonialism by Lewis H. Gann and Peter Duignan (1975).
- The Political Economy of a Common Currency: The CFA Franc Zone Since 1945 by Dr. David Stasavage (2003).
- Les Servitudes du Pacte Colonial by Dr. Mamadou Koulibaly (2005).
- The French Empire Between the Wars: Imperialism, Politics and Society by Martin Thomas (2005).
- When War Ends: Building Peace in Divided Communities by Professor David J. Francis (2008).
- History Of Development 3rd Edition by Gilbert Rist (2009).
- France and the New Imperialism: Security Policy in Sub-Saharan Africa by Dr. Bruno Charbonneau (2013).
In this post, I will focus my discussion on the facets of the Colonial pact that pertain to the management of the financial reserves of former French colonies.
In the late 1950s, France's African colonies, excluding Algeria, signed an agreement that:
- Obliged the African parties to the agreement to deposit 65% of (current and future) financial reserves in either of two CFA-Franc union banks (depending on the location of the country).
- Compelled the African states to surrender 20% of (current and future) financial reserves to the French Treasury. These funds would be warehoused in an "operations account" that would be used to: 1) Settle offshore liabilities of CFA-Franc union states, and; 2) Guarantee the convertibility of the two CFA-Franc monetary units of account (i.e. the West African CFA-Franc and the Central African CFA-Franc).
- Allowed the African States to keep 15% of (current and future) financial reserves.
From the preceding bullet points, it is evident that the annual foreign currency earnings of each CFA-Franc union nation have the following destinations:
 |
| Illustration 1 (click on illustration to zoom in) Adapted From: Koulibaly, 2005 |
To further-illuminate the web of relationships that underpin the management of the CFA-Franc union's reserves, Illustration 2, below, will be employed:
 |
| Illustration 2 (click on illustration to zoom in) Adapted From: Koulibaly, 2005 |
Illustration 2 is an extension of Illustration 1. It demonstrates that the foreign currency reserves of CFA-Franc union states have three principal destinations:
- The Nation's Central Bank: As Illustration 1 demonstrated, 15% of the forex earnings of a CFA-Franc union state are deposited directly in the reserve account of the central bank of the state.
- The French Treasury: As Illustration 1 demonstrated, 20% of the forex earnings of a CFA-Franc union state are deposited directly in the "operations" account of the French Treasury.
- The CFA Area Bank: As Illustration 1 demonstrated, 65% of the forex earnings of a CFA-Franc union state are deposited in an account with the local CFA Area Bank.
Theoretically, the funds that are held by the CFA Area Bank are "domiciled" in Africa and managed by the CFA Area Bank. But, in reality, as the grey arrow in Illustration 2 demonstrates, the "CFA Area Bank" is, in essence, a feeder-fund of the French Treasury.
Otherwise put, once the reserves have been transferred to the CFA Area Bank, they are directly transferred to the French Treasury for management.
Illustration 3, below, depicts the two CFA-Franc union banks and the member states of each of the two CFA-Franc zones:
 |
| Illustration 3 (click on illustration to zoom in) Adapted From: Koulibaly, 2005 |
Curiously, CFA-Franc union member states:
- Never receive any bank account statements: They have no access to information on their respective or collective bank account balances, and, they are not informed of the prevalent interest rates on their deposits. Further, they do not know how much interest has been accrued on the deposits they made.
- They cannot "withdraw" their funds, in the traditional sense: If they need funding in excess of the "15% allotment" of their reserves, they have to borrow money from the CFA-Franc Area banks, at interest rates that are in the 5% to 6% range. Loans from the monetary union banks are capped at 20% of the borrower's tax revenues in the preceding year.
Succinctly put; once funds are deposited in CFA-Union banks, they are managed using black-box strategies and locked-up indefinitely. Indeed, this sounds like a diabolical plot from the most deranged and florid conspiracy theory. But, this is, regrettably, a factual account.
Naturally, this begs the question: How much money is in CFA union banks, or rather, the French Treasury? To answer this question as accurately as possible, it is important to distinguish between: Known-Knowns, Known-Uknowns, Unknown-Knowns and Unknown-Uknowns.
To do this, I'll use the two-by-two matrix in Illustration 4:
 |
| Illustration 4 (click on illustration to zoom in) |
Illustration 4 is a shades of grey metaphor, which basically serves to illustrate that the lighter shades of grey, i.e. Known-Knowns and Known-Unknowns, will illuminate the darker shades of grey, i.e. Unknown-Knowns and Unknown-Unknowns.
***
As Illustration 4 demonstrates, the most critical Known-Known is GDP. One of the most reliable databases of GDP figures, which factors-in relative standards of living, is the University of Groningen Development Center's Penn World Table. From the open-access resource, I extracted the GDP figures of 13 out of 14 CFA-Franc union nations. And, I aggregated the USD GDP figures of each nation from 1960 to 2011. Luckily, the GDP figures were expressed in real terms, so I did not have to adjust them for inflation before I used them.
The result of this exercise was Illustration 5 below:
 |
| Illustration 5 (click on illustration to zoom in) Adapted From: University of Groningen, 2014 |
Illustration 5 demonstrates that the jewels of the CFA-Franc union, as far as economic weight is concerned, are the Ivory Coast, Cameroon and Senegal.
Once I had derived the database of aggregated GDP figures, I faced the challenge of building a database of the tax revenues of CFA-Franc union nations. One of the most reliable open-access resources for this endeavor was the World Bank's database of development statistics. Unfortunately, the tax revenue time series of CFA-Franc area nations had large gaps.
From the range of the data that was available, it was evident that a tax-revenue estimate in the 11%-of-GDP-range would suffice for all countries. I then calculated 11% of each GDP figure in the time-series that underpins Illustration 5. And, I came-up with the aggregated dataset in Illustration 6:
 |
| Illustration 6 (Click on Illustration to zoom in) Adapted From: University of Groningen, 2014; World Bank, 2014, and; Chirinda, 2014 |
The shaded elements of Illustration 6 reveal that the biggest tax revenue generators in the CFA-Franc region are; Ivory Coast and Cameroon. Again, this comes as no surprise.
Once I produced the time series of revenue figures and aggregated them, I faced the challenge of building a database of the Export figures of CFA-Franc union states. From the World Bank's database of development statistics, I was able to locate the database of export metrics.
They were expressed as a proportion of GDP as is shown in the abbreviated of dataset in Illustration 7:
 |
| Illustration 7 (click on illustration to zoom in) Adapted From: World Bank, 2014 |
As Illustration 7 demonstrates, the countries that depend most on exports to generate GDP growth include: Congo Brazzaville, Gabon, Mauritania, Togo and the Ivory Coast.
If you multiply the timeseries that underpins Illustration 5 by the timeseries that underpins Illustration 7, you'll produce the export timeseries of CFA-Franc Area nations. Illustration 8, below summarizes the export timeseries which I produced:
 |
| Illustration 8 (click on illustration to zoom in) Adapted From: World Bank, 2014, and; University of Groningen, 2014 |
As Illustration 8 demonstrates, in US dollar terms, the largest exporters in the CFA-Franc region are the Ivory Coast, Cameroon, Gabon and Senegal.
***
Interestingly, the datasets that were presented in Illustrations 5, 6, 7 and 8 morphed the following Known-Unknowns into Known-Knowns:
- The export figures of CFA-Franc area nations since the 1960s.
- The tax revenues that were earned by CFA-Franc area nations since the 1960s.
These two information pieces will help to answer the following questions:
- How much money was transferred from CFA-Franc area nations to France since 1960?
- How much money was borrowed, or "withdrawn", by CFA-Franc area nations, from CFA-Franc area banks?
...Allocative Effects of the CFA-Franc zone arrangement
The CFA-Franc area is not an optimum currency area. Otherwise put, is it the grouping of widely dissimilar and economically unequal nations. Fundamentally, this simply implies that the monetary zone cannot remain intact unless there are explicit or implicit transfers of wealth from economically stronger states to the weaker states. Otherwise put in contemporary parlance; there is a Germany-Greece dynamic in the CFA-Franc union area.
Naturally, this begs the following questions: 1) Who are the “profligate idiots”?, and; 2) Which countries can be defined as centers of fiscal rectitude:
To answer this question, I had to revisit the basic principles of the CFA-Franc area to identify the mechanisms for:
- Contributing money to the system.
- Taking money out of the system.
Just to recap:
- The system's inflows are the export proceeds of CFA-Franc area nations. 65% of them are deposited with the CFA-Franc area central banks.
- The outflows from the system are loans from the CFA-Franc area Central banks. They are capped at 20% of a nation's tax revenues in the preceding year.
Circuitously, this simply implies that the nations that have relatively higher taxes and relatively lower exports benefit from the system at the expense of the nations that have relatively lower taxes and relatively higher exports.
Otherwise put, countries with a high (tax) revenue-to-exports ratio are living-off countries with a low (tax) revenue-to-exports ratio.
Otherwise put, countries with a high (tax) revenue-to-exports ratio are living-off countries with a low (tax) revenue-to-exports ratio.
Illustration 9 depicts the revenue-to-exports ratio of CFA-Franc area nations:
 |
| Illustration 9 (click on Illustration to zoom in) Adapted From: University of Groningen, 2014; World Bank, 2014, and; Chirinda, 2014 |
From Illustration 9, it is evident that the CFA-Franc area arrangement disproportionately benefits Guinea Bissau, Niger and Benin, and that the system is most unfair to; Gabon, Burkina Faso and Congo Brazzaville.
The relationship between revenue and exports unearths the CFA-Franc area's hidden perverse incentive. It is shown in the vicious cycle in Illustration 10 below:
 |
| Illustration 10 (click on illustration to zoom in) |
The debt binge in Illustration 10 cannot go on ad infinitum. Usually, it ends in:
- A fiscal crisis and forced austerity: In his text which is titled The Political Economy of a Common Currency: The CFA-Franc Zone Since 1945 (The International Political Economy of New Regionalisms) David Stasavage (2003) chronicles the fiscal problems that have afflicted CFA-Franc union nations since 1945. It is not feasible for me to delve into his narrative in great depth, so you may want to purchase the book.
- A coup (If the debt crisis adversely affects the upkeep and provisioning of the army): By and large, poorly remunerated soldiers are mutinous soldiers. A cursory analysis of the Integrated Network for Societal Conflict Research's (INSCR) database for Peace and Security reveals that, on average, 2.51 coups are attempted in the CFA-Franc region per year. These attempted coups have an average success rate 56%, and, an average body count of 254 cadavers per coup.
When I was going through the geopolitical and export data of the CFA-Franc zone, I developed the urge to answer the following burning question: What is the relationship between the (tax) revenue-to-export ratio of CFA-Franc zone nations and success rate of coups that have occurred in the monetary union?
Illustration 11, below, answers the question:
 |
| Illustration 11 (click on illustration to zoom in) Adapted From: World Bank, 2014, INSCR, 2014, and Chirinda, 2014 |
As Illustration 11 demonstrates:
- For the countries that are prejudiced by the CFA-Franc zone arrangement (indicated by the blue shaded region in Illustration 11): The higher their (tax) revenue-to-exports ratio; the lower the success rate of a coup. Clearly this indicates that ― in nations that are prejudiced by the CFA-Franc zone arrangement ― there is an inverse relationship between the (tax) revenue-to-exports ratio and the success rate of coups.
- For the countries that are not exactly prejudiced or unfairly rewarded by the CFA-Franc zone arrangement (indicated by the red shaded region in Illustration 11): The higher their (tax) revenue-to-exports ratio; the higher the success rate of a coup. Clearly this indicates that ― in countries that are not exactly prejudiced or unfairly rewarded by the CFA-Franc zone arrangement ― there is a direct relationship between the (tax) revenue-to-imports ratio and the success rate of coups.
...How much of the CFA-Franc Zone's money is in French Banks?
“We have to be truthful and admit that the bulk of the money in French Banks originated from the exploitation of Africa.”
― Jacques Chirac (French President 1995 - 2007), Interview
“The African people’s money stacked in France must be returned to Africa in order to benefit the economies of the BCEAO member states. One cannot have billions and billions placed on foreign stock markets and at the same time say that one is poor, and then go beg for money"
― Abdoulaye Wade (Senegalese President 2000 - 2012), November 2007 Speech
To calculate the value of the CFA-Franc zone's money that is in “French Banks”, I formulated the following set of assumptions:

'
To value the reserves, I formulated the following model, which takes into account the aforementioned assumptions:
The equation simply says that the aggregate reserves of CFA-Franc zone countries can be computed by:
- Adding the liabilities, for a specific country and a specific year, to the potential drawings;
- Subtracting the result from the corresponding net exports figure;
- Adding the time series of the adjusted net export figures of a specific country from 1960 to 2011;
- Adding the aggregated adjusted figures of CFA-Franc zone countries to each other;
The result of this four-step computational process is the aggregated Net Reserves figure.
Interestingly, the model can be alternatively expressed as follows:
In reality, CFA-Franc zone nations finance their imports using an admixture of their 15% annual allotment of their reserves, borrowings from CFA-Franc zone banks (that are equivalent to 20% of a nation's tax revenues from the preceding year), and, debt from other sources.
Thus, a more accurate expression of the valuation model can be found below:

To arrive at the aggregate exports figure of the CFA-Franc zone from 1960 to 2011, one would need to sum the total export figures of each CFA-Franc zone country as is shown in Table 1 below:
 |
| Table 1 (click on table to zoom in) Adapted From: World Bank, 2014 |
As Table 1 shows, between 1960 and 2011, CFA-Franc zone countries exported $1,668,004,706,174.03 worth of goods to the world.
Table 2 aggregates the liabilities totals of CFA-Franc zone countries:
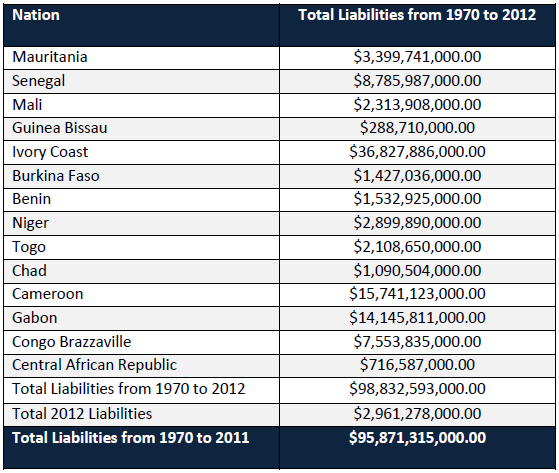 |
| Table 2 (click on table to zoom in) Adapted From: Reinhart and Rogoff, 2014; University of Groningen, 2014 |
In Table 2:
- 2012 liabilities were subtracted from the dataset, as they were not in the range that was under consideration; 1960 to 2011.
- There was a 10-year gap in the dataset which I used. During the 41-year period that was explored in Table 2, liabilities for the entire zone stood at an average of $2,338,324.756.10 (in each year). Hence, to fill the gap between 1960 and 1969 (inclusive), liabilities are assumed to be $2,338,324.756.10 per year. Therefore, this simply implies that the grand total for liabilities is $119,254,562,560.98.
Table 3 aggregates the potential drawings of each country from 1960 to 2011:
 |
| Table 3 (click on table to zoom in) Adapted From: World Bank, 2014 |
As Table 3 shows, the grand-total for potential drawings is $118,846,971,939.64.
Tables 1, 2 and 3 are all that is needed to compute the net reserves of CFA-Franc zone.
To calculate the net reserves, it is important to be cognizant of the following things (refer back to Illustration 1):
- 65% of the gross reserves is deposited in CFA-Franc zone area banks.
- 20% of the gross reserves is deposited in the "operations" account of the French treasury for liabilities management.
- 15% of the gross reserves is transferred directly to the states.
Hence, the net reserves of CFA-Franc zone nations are:
 |
| Table 4 (click on table to zoom in) |
To arrive at the net figures in Table 4:
- Deposits in CFA-Franc zone Central banks were adjusted for "withdrawals".
- The liabilities grand total was subtracted from the Liabilities Management Reserve.
As Table 4 shows, between 1960 and 2011, Mauritania, Senegal, Mali, Guinea Bissau, Ivory Coast, Burkina Faso, Benin, Niger, Togo, Chad, Cameroon, Gabon, Congo Brazzaville and the Central African Republic deposited a combined sum of $965,356,087,073.48 in their respective CFA-Franc Zone Central Bank accounts (This figure doesn't account for interest accrued and it is not a nominal figure). [1]
At this year’s EU-Africa summit I hope that the delegates will discuss:
- The modalities that would be put in place to allow CFA-Franc zone states to access this money.
- The formula that would be used to compute the interest that is payable to the depositors of the-said funds.
- A plan for disbanding the CFA-Franc Union and the Françafrique policy which buttresses it.
[1] Post script 24 April 2014: Take this figure as a back of the envelope calculation. If I encounter better data, I will refine it.