 |
| Illustration 1 (click on illustration to zoom in) Source: Bridgewater Associates |
This de-levering process is known, in financial sector parlance (read: "Bridgewater Associates parlance") as a "Deleveraging". According to Ray Dalio, the founder of Bridgewater Associates, deleveragings occur when:
- An economy (i.e. the private sector and the public sector) has accumulated too much debt. In the US, the total debt (i.e. private sector debt plus public sector debt) was close to 370% of the US's GDP when the crisis hit, see Illustration 1.
- The economy starts to soften and interest rates are already so low that the central bank cannot stimulate the economy by reducing them. This deflates GDP. In 2008, the US economy had softened owing to rising delinquencies in the subprime mortgate sector and real interest rates stood at approximately 2.85%.
"The differences between deleveragings depend on the amounts and paces of 1) debt reduction, 2) austerity, 3) transferring wealth from the haves to the have-nots, and 4) debt monetization. Each one of these four paths reduces debt/income ratios, but they have different effects on inflation and growth. Debt reduction (i.e., defaults and restructurings) and austerity are both deflationary and depressing while debt monetization is inflationary and stimulative"From this assertion, Illustration 2 can be derived:
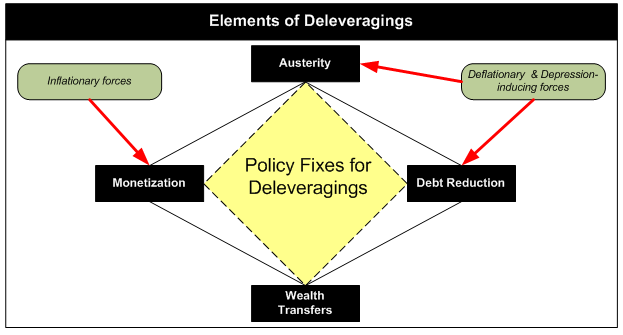 |
| Illustration 2 (click on illustration to zoom in) |
Hence, the management of a deleveraging essentially entails balancing Deflationary and Depression-inducing Forces (i.e. Debt reduction and Austerity) and Inflationary Forces (i.e. Monetization).
Illustration 3, below, depicts what Ray Dalio would call a beautiful deleveraging, i.e. a deleveraging in which Inflationary Forces (i.e. debt monetization) are sufficient enough to just offset Deflationary Forces (Austerity and Debt Reduction).
 |
| Illustration 3 (click on illustration to zoom in) |
The deleveraging process that occurred in the US from 2008 to date can be characterized as a beautiful deleveraging, because:
1) US nominal GDP growth is in positive territory and it shows no sign of dipping:
 | ||
| Illustration 4 (click on illustration to zoom in) |
As Illustration 4 above shows, the US's nominal GDP growth rate is on a positive trajectory and it shows no signs of dipping. However, nominal GDP of the US currently stands at 1.22% which is below its 2% long term average. Further, the US's real GDP growth rate stands at 0.4994%. Therefore, it is reasonable to assert that the US economy has registered a weak recovery. However, it has managed to mitigate the impact of Deflationary and Depression-Inducing Forces.
2) Inflation is low:
 |
| Illustration 5 (click on illustration to zoom in) |
The US's inflation rate currently stands at 1.99%, which is substantially lower than the pre-crisis inflation rate level as is shown in Illustration 5. Thus, it is reasonable to assert that the US Fed, Treasury and Government have done a good job; they have made the US deleveraging as beautiful as possible (refer to Illustration 1).
Further, it is also reasonable to assert that the quantitative easing policy of the US Fed has not, as some quarters suggest, created an unbalanced and ugly inflationary deleveraging like the deleveraging process that is depicted in Illustration 6 below:
 | |||
| Illustration 6 (click on illustration to zoom in) |
***
...Obama's Economic Path
The Quantitative Easing policy that was undertaken by the FED is a form of wealth transfer that essentially debases the value of the USD vis-a-vis the price of gold, which inflates away the real debt of borrowers; thus, making it easier for them to reduce their debt loads. Further, entitlement spending is another wealth transfer that eases the suffering of the poor, while the economy is recovering. This reduces the risk of poverty-driven social unrest.
In recent times, the Obama administration has stated its desire to allow the Bush tax cuts for wealthy Americans to expire. This is essentially a wealth transfer that would, according to pronouncements that were made by the Obama administration, fund infrastructure spending and spending on Pell Grants for higher education. These expenditures would help to stimulate the US economy in the short term and enhance the competitiveness of the US in the long term.
Hiking the taxes of JUST the wealthy Americans sounds like a raw deal; all sacrifices and pains should be shared equally, right? Well, the answer to that question is: not exactly.
To drive my point, I will use this excerpt from Chrystia Freeland's book entitled "Plutocrats: The Rise of the New Global Super Rich and the fall of Everyone Else":
"Consider America’s economic recovery in 2009–2010. Overall incomes in that period grew by 2.3 percent—tepid growth, to be sure, but a lot stronger than you might have guessed from the general gloom of that period.
Look more closely at the data, though, as economist Emmanuel Saez did, and it turns out that average Americans were right to doubt the economic comeback. That’s because for 99 percent of Americans, incomes increased by a mere 0.2 percent. Meanwhile, the incomes of the top 1 percent jumped by 11.6 percent. It was definitely a recovery—for the 1 percent"From the excerpt, it is clear that the recovery that occurred did not benefit everyone equally. Hence, it is reasonable to assert that the Obama administration's intention to increase the taxes of the wealthiest Americans, while extending the Bush-era tax cuts for the poor and the middle class, is fair. Because, as Thomas Jefferson observed, "there is nothing more unequal than the equal treatment of unequal people".
Hence, I can only conclude that: Obama's Tax Policies + Bernanke's QE Infinity = US Out of Great Recession
***
...What would have happened if the Romney-Ryan ticket had won the US presidential election?
Romney:
- Indicated that he wanted someone more Hawkish (than Bernanke) in charge of the FED; someone who would put the brakes on Bernanke's QE infinity programme; i.e. someone who would tame inflationary pressures.
- Indicated that he wanted to cut down on entitlement spending. And, that he also intended to extend the Bush-era tax cuts for everyone (the wealthy, middle class and the poor). Thus, there would essentially be no wealth transfers from the rich to the poor.
 | |||||
| Illustration 7 (click on illustration to zoom in) |
Illustration 7 depicts the unbalanced deflationary deleveraging that would occur in the US if the Romney Camp's economic recommendations were implemented. Such a deleveraging would be reminiscent of the deleveragings that occurred in:
- The US from 1930 to 1932.
- Japan from 1990 to present.
- The US from July 2008 to February 2009 (pre-Quantitative Easing)
- Spain from September of 2008 to present.
 |
| Illustration 8 (click on illustration to zoom in) |
This shift is essentially a movement from Phase 2 of the deleveraging process back into Phase 1 of the deleveraging process, where (refer to Illustration 8):
- There would be not enough money to service debts.
- Demand for goods and services falls because of tightness of liquidity and private sector credit contraction.